Different investors react in different ways to the price action that drives a stock from a low to high and back again. For growth investors, for example, a stock at or near historical highs usually means they’ll sit up and start trying to figure out how much further it could go up, while they discard any notion about working with a stock dropping significantly off of those highs. Yet for value investors, the high-fliers are exactly the kinds of stocks to avoid, and the stocks that have dropped off of their highs, and possibly could be plumbing historical lows become more and more interesting the cheaper they get.
While there isn’t much point in trying to decide which approach is better – that is an entirely subjective opinion that has to be balanced against an individual’s tolerance for risk, investment objective, and investing resources – the distinction between the two styles is interesting to see. It’s part of what drives the ebb and flow of market attention, as the stocks running to new highs get applauded on market media and by talking heads and the ones dropping to new lows are dismissed. For a value investor, that fall from grace is part of what creates an opportunity for competitive advantage versus other investors; because if the stock can be found to not be simply cheap, but worth far less than the value of the core business, there is often a sizable, long-term opportunity that everybody else is missing.
Scorpio Tankers Inc. (STNG) is a small-cap company in the Energy sector, with a specific focus on oil transportation. That ties a major portion of the company’s fortunes to the ebb and flow of oil prices, which of course experienced a historic collapse in demand in 2020 due to the global pandemic. Broad economic indicators suggest that travel demand, which is a big driver in sustaining higher oil prices, has started to recover this year – but recent surges in infections and hospitalizations from COVID-19 variants have recently been described by some companies in the Transportation industry as headwinds against current and near-term results. That has put some pressure back on oil prices and the Energy sector in general; it has also, presumably been a primary reason that STNG reversed an impressive upward trend in June and has dropped more than -41% from that peak. The question for a value-focused investing approach, of course is whether that drop has created a useful value-oriented opportunity? If the company’s fundamentals are strong enough, it could be something you should be paying attention to.
Fundamental and Value Profile
Scorpio Tankers Inc. (Scorpio Tankers) is a Monaco-based company active in the oil transportation industry. The Company is engaged on the seaborne transportation of refined petroleum products in the international shipping markets. Scorpio Tankers operates through four segments: Handymax, MR (Medium Range), Long Range 1 (LR1)/Panamax and Long Range 2 (LR2)/Aframax. Each of the Company’s segments represents a different type of vessel with which it operates, with the total number of vessels being around 110. Handymax represents the smaller type of ship that the Company operates with, followed by MR, LR1 and LR2 being the biggest one. The Company operates with ships under its own ownership as well as finance leased or chartered-in. STNG has a current market cap of $848.7 million.
Earnings and Sales Growth: Over the past year, earnings declined by more than -139%, while sales were almost -60% lower. In the last quarter, earnings improved by about 10.5%, while sales increased by almost 4%. Despite the improvement in earnings last quarter, the company’s operating profile shows significant signs of weakness; over the past year, STNG’s Net income as a percentage of Revenues was nearly -36% over the last twelve months. Given the difficulties every sector has dealt with during the pandemic, that isn’t particularly surprising, but the story deteriorated even further in the last quarter, as Net Income was a little over -38% of Revenues. This is a major red flag; improvement (if not a complete swing back to positive territory) in the quarters ahead would be required to make the stock’s fundamentals suitably attractive.
Free Cash Flow: STNG’s Free Cash Flow, which had previously been a sign of strength, swung into negative territory in the last quarter, at -$48.6 million over the last twelve month. By comparison, Free Cash Flow was $262.46 million in the quarter prior, and $316.2 million a year ago. The negative Free Cash Flow pattern is a solid confirmation of the weakness signaled by the company’s Net Income profile.
Debt to Equity: STNG has a debt/equity ratio of 1.11, which indicates the company is highly leveraged. The company’s balance sheet shows cash and liquid assets of about $282.2 million in the last quarter versus long-term debt of about $839 million. Ironically, cash and liquid assets have increased over the last year, but given the weakness in Net Income and Free Cash Flow it is expected liquidity will show confirming deterioration in the quarters ahead, since the company is currently required to draw on cash reserves to service its debt burden.
Dividend: STNG pays an annual dividend of $.40 per share, which at the stock’s current price translates to a dividend yield of about 2.75%. While management has maintained the dividend for most of the past year, the current pattern of non-profitability naturally brings the sustainability of the dividend into question.
Price/Book Ratio: there are a lot of ways to measure how much a stock should be worth; but I like to work with a combination of Price/Book and Price/Cash Flow analysis. Together, these measurements provide a long-term, fair value target a little above $22.50 per share. That suggests that STNG is undervalued by about 55% from its current price.
Technical Profile
Here’s a look at the stock’s latest technical chart.
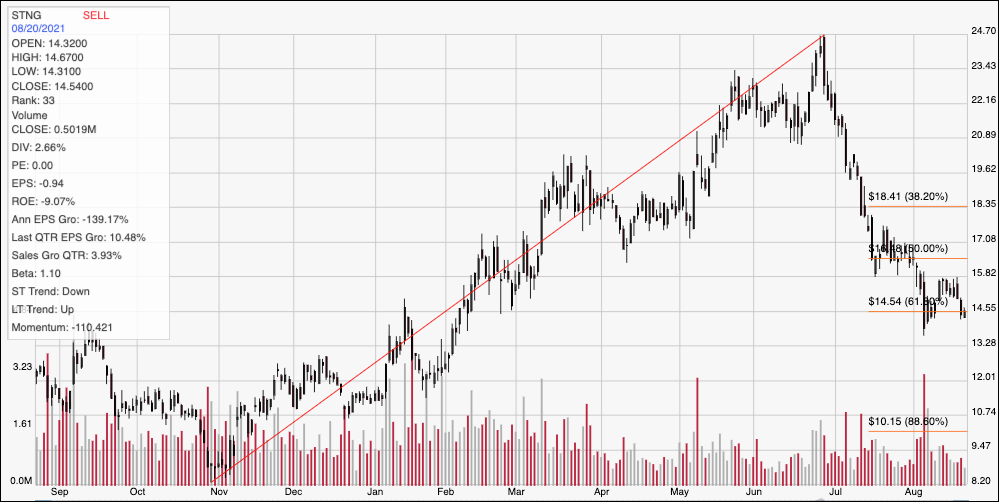
Current Price Action/Trends and Pivots: The chart above displays the last year of price activity for STNG. The diagonal red line marks the stock’s upward trend from November 2020 to late June, with the peak at around $24.70. It also provides the baseline for the Fibonacci retracement lines shown on the right side of the chart. The stock’s decline off of that June high was rapid, with the stock dropping to about $14.50 at the beginning of August, where the 61.8% retracement line sits. The stock appears to be trying to stabilize around that level, which could be an encouraging sign that the downward trend has ended and may be in position to reverse; however support at $14.50 would need to hold current pressure for that to apply. Immediate resistance isn’t far away, sitting a little above the 50% retracement line at around $17. A drop below $14.50 could see the stock find next support between $12.50 and $12, based on pivot activity at the end of 2020. A push above $17 should have additional upside to about $18.50 where the 38.2% retracement line sits.
Near-term Keys: STNG’s value proposition looks very tempting, and could be mistaken as a good value bait for an overaggressive investor. The problem is that the company’s current pattern of nonprofitable activity, with high debt and no operating profits to preserve the company’s liquidity make the stock look more like a value trap than a useful value right now. That also means that the best probabilities to work with STNG lie in short-term trading strategies. If the stock can bounce off of current support at around $14.50, you could consider buying the stock or working with call options, using $17 as an attractive short-term profit target, and $18.50 possible if bullish momentum increases. A drop below $14.50, on the other should be taken as a signal to consider shorting the stock or buying put options, with next expected support at around $12 offering an attractive bearish profit target.