Markets are naturally cyclical – they swing from high to low and back again on a consistent, if unpredictable basis over a range of time frames. The different time periods associated with any given cycle, or sometimes even the depth of a certain cycle’s direction, can shade the casual investor’s perception about a stock’s opportunity. The most recent major bull market, which extended itself over a more than ten-year time period and was only briefly interrupted by the global pandemic, is a good example; because of both the unprecedented time period that market’s bullish run covered, and even more particularly the higher-than-average runs that run covered during its last couple of years, a lot of average investors made the mistake of assuming that the market would simply continue that run.
Technically speaking, that bull market ended in February 2020, as COVID-19 made its way to North American shores and prompted not just national, but global shutdowns that shuttered entire industries for an extended period of time. The irony of the story is that while the market reacted equally as violently – every major market index plunged by about -20% in less than a month – the recovery only took slightly longer, recovering pre-pandemic highs by late spring of last year. From that point the market has resumed the direction of that much longer-term upward trend, making the “COVID bear market” look like just another bump in the road.
While coronavirus is not yet a thing of the past, and rising infections and hospitalizations remains question marks and legitimate concerns that must be addressed, the fact is that just about every major economic indicator is reflects increasing economic health in a broad-based sense. Even unemployment, which surged last year to historically high levels but lagged the rest of the general pattern of economic growth, has begun to approach healthier levels, with pre-pandemic numbers no longer out of the question in the next few months. For many, all of that positive news is a good reason to assume that the “good times” are back again and it’s time to put the foot on the gas. I’m a little more wary – I’m certainly not calling for a resumption of the difficulties of the past year, but surging inflation at some point should prompt the Federal Reserve to being raising interest rates. The current pace of economic growth is also not without its significant holes; supply shortages in a variety of industries that can still be tied to issues ranging from limitations on production capacity due to stricter safety measures, to legitimate difficulties a number of companies are having filling open positions to meet increased demand are just a few examples of questions that don’t seem to be getting a lot of attention right now. For a somewhat contrarian-minded investor like me, that means that it’s one thing to be open to good buying opportunities right now – but it is still smart to think in very careful, selective terms. For the stock market, that means not simply taking a stock’s price action – up or down – at face value without first diving into the company’s fundamentals.
Oshkosh Corporation (OSK) is a good example of what I mean. From November of last year to May of this year, the stock more than doubled in price, rising quickly from around $67 to a peak at nearly $138 per share. From that point, the stock has tapered back into an intermediate-term downward trend that as of this writing has shaved about -16% off of the stock’s all-time high. That decline comes in the face of fundamental strengths that include improving profitability, increasing free cash flow, and strengthening liquidity in its balance sheet. That’s an interesting mix for a value-oriented investor; is it enough to make the stock actually work as a legitimate value-driven, long-term opportunity? Let’s look at their fundamentals and see if we can decide.
Fundamental and Value Profile
Oshkosh Corporation (OSK) is a designer, manufacturer and marketer of a range of specialty vehicles and vehicle bodies, including access equipment, defense trucks and trailers, fire and emergency vehicles, concrete mixers and refuse collection vehicles. The Company’s segments include Access Equipment; Defense; Fire & Emergency, and Commercial. The Access Equipment segment consists of the operations of JLG Industries, Inc. (JLG) and JerrDan Corporation (JerrDan). The Defense segment consists of the operations of Oshkosh Defense, LLC (Oshkosh Defense). The Fire & Emergency segment consists of the operations of Pierce Manufacturing Inc. (Pierce), Oshkosh Airport Products, LLC (Airport Products) and Kewaunee Fabrications LLC (Kewaunee). The Commercial segment includes the operations of Concrete Equipment Company, Inc. (CON-E-CO), London Machinery Inc. (London), Iowa Mold Tooling Co., Inc. (IMT) and Oshkosh Commercial Products, LLC (Oshkosh Commercial). OSK has a current market cap of about $7.9 billion.
Earnings and Sales Growth: Over the last twelve months, earnings increased by 62%, while revenues rose nearly almost 40%. In the last quarter, earnings increased by more than 41% while sales were nearly 17% higher. The company’s operating margin has survived the difficulties of the past year quite nicely; over the last twelve months, Net Income as a percentage of Revenues was 6.48% and increased in the last quarter to 9.68%. The increase is a solid indication of operating strength.
Free Cash Flow: OSK’s free cash flow is healthy and growing, at about $1 billion over the past year. This number marks an improvement from the last quarter, which was $902 million, and even more notably an increase from $238.3 million a year ago. The current number also translates to a Free Cash Flow Yield of 13.47%.
Dividend: OSK’s annual divided is $1.32 per share, which translates to a yield of about 1.17% at the stock’s current price. It also marks an increase from $.96 per share, per annum around the middle of 2018 and $1.20 per share one year ago. An increasing dividend is a strong sign of management’s confidence in its business plan and operating model. Even with the increase, it is also worth noting that OSK maintains a conservative payout ratio; the current annualized dividend is less than 25% of the company’s total earnings per share over the last twelve months.
Price/Book Ratio: there are a lot of ways to measure how much a stock should be worth; but I like to work with a combination of Price/Book and Price/Cash Flow analysis. Together, these measurements provide a long-term, fair value target at about $142.50 per share. That means the stock is trading at an interesting, and useful discount, with 24% upside from the stock’s current price.
Technical Profile
Here’s a look at the stock’s latest technical chart.
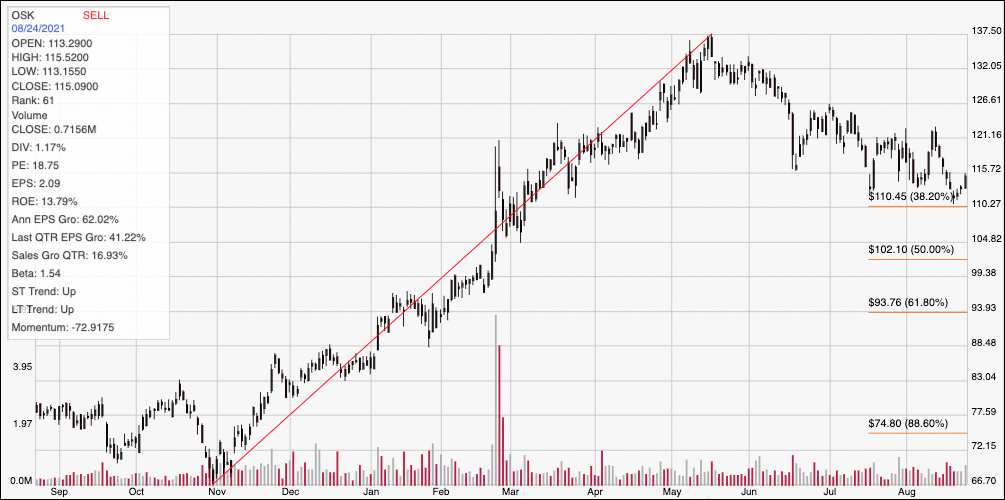
Current Price Action/Trends and Pivots: The red diagonal line measures the length of the stock’s upward trend from its November 2020 low at around $67 to its all-time high in May at around $137.50; it also informs the Fibonacci trend retracement lines shown on the right side of the chart. From that peak, the stock has dropped back into a clear downward trend, most recently finding near-term support at around $110, roughly in-line with the 38.2% retracement line. Immediate resistance is at around $116, just a little above the stock’s current price as it has rebounded in the last few days. A push above $116 should see upside to about $121 in the very short term, while a drop below support at $110 could fall to between $104 and $102, where the 50% retracement line is waiting to act as secondary support.
Near-term Keys: OSK’s value proposition looks attractive right now, and for the company’s balance sheet remains healthy and in better shape than many other companies that have spent the past year and a half dealing with the reality of pandemic-driven difficulties. If you’re willing to accept the potential for continued near-term volatility, this is a stock that looks like a good value. The stock also has some interesting possibilities for short-term traders; watch for a break above $116 as a signal to consider buying the stock or working with call options, using $121 as a useful, short-term profit target. A drop back below $110 should be taken as a strong signal to consider shorting the stock or buying put options, with downside to next support between $104 and $102 providing a useful profit target on a bearish trade.
Oshkosh Corporation (OSK) is a good example of what I mean. From November of last year to May of this year, the stock more than doubled in price, rising quickly from around $67 to a peak at nearly $138 per share. From that point, the stock has tapered back into an intermediate-term downward trend that as of this writing has shaved about -16% off of the stock’s all-time high. That decline comes in the face of fundamental strengths that include improving profitability, increasing free cash flow, and strengthening liquidity in its balance sheet. That’s an interesting mix for a value-oriented investor; is it enough to make the stock actually work as a legitimate value-driven, long-term opportunity? Let’s look at their fundamentals and see if we can decide.