No matter what current market conditions may be at any given time, one of the primary questions any long-term focused investor – whether you prefer a growth or value approach – should be whether the strength of the underlying business is strong enough to justify a stock’s current price. For growth-focused investors, the question is primarily about whether measurements like revenue and earnings are growing, and are expected to continue to grow, enough to justify buying the stock, even at a relatively high current price. For value-oriented investors, the question is similar, but somewhat different, since the question revolves around determining how to translate a company’s fundamental strengths into a useful price-based reference, against which you can then compare the stock’s current price.
The value question tends to become more complicated when a stock has followed a long-term upward trend, with indications that it could continue doing so like a generally healthy economy, lower-trending unemployment, and a generally robust consumer environment. Even with pandemic-driven concerns mixed, that is the environment that we find ourselves in right now, and it is a combination that has helped a lot of large retailers like WalMart Inc. (WMT) and Target Corp (TGT) to not merely survive, but also to thrive for the past year and a half. That is an interesting statement to make right now, because while the “big boys” in the Retailing industry have been feasting, smaller retailers, including regional and local small businesses have struggled to stay in business at all.
TGT is an interesting company, that has managed to forge its own solid spot in the retail industry even as competition in the space has greatly intensified. The stock increased by nearly double from September of 2020 to the early part of this month, driving from around $143 to a peak at around $267. Is that big, upward run too much for the company’s fundamentals to keep up with, and if so, where can we put a “fair value” price for the stock? Let’s dive in.
Fundamental and Value Profile
Target Corporation (Target) is a general merchandise retailer selling products through its stores and digital channels. Its general merchandise stores offer an edited food assortment, including perishables, dry grocery, dairy and frozen items. Its digital channels include a range of general merchandise, including a range of items found in its stores, along with an assortment, such as additional sizes and colors sold only online. Its owned brands include Archer Farms, Market Pantry, Sutton & Dodge, Art Class, Merona, Threshold, Ava & Viv, Pillowfort, Room Essentials, Wine Cube, Cat & Jack, Simply Balanced and Wondershop. Its exclusive brands include C9 by Champion, Hand Made Modern, Mossimo, DENIZEN from Levi’s, Nate Berkus for Target, Fieldcrest, Kid Made Modern, Genuine Kids from OshKosh and Liz Lange for Target. As of January 28, 2017, the Company had 1,802 stores across the United States, including 1,535 owned stores, 107 leased stores and 160 owned buildings on leased land. TGT’s current market cap is $121.9 billion.
Earnings and Sales Growth: Over the last twelve months, earnings and sales have increased, with earnings increasing about 7.7%, and sales growing about 9.5%. In the last quarter, earnings declined somewhat, by -1.38% while revenues increased almost 4%. Like most stocks in this sector, the company operates with a narrow margin profile that has nonetheless improved in the last few months. As a percentage of Revenues, Net Income was 6.29% in the last year, and increased to 7.22% in the last quarter.
Free Cash Flow: TGT’s free cash flow is healthy, at more than $6.3 billion. A year ago, this number was about $7.4 billion. The current number translates to a Free Cash Flow Yield of 5.07%.
Debt to Equity: TGT has a debt/equity ratio of .78. This is a conservative number that generally suggest the company’s operating profits are sufficient to service the debt they have. They also have good liquidity, with $7.8 billion in cash and liquid assets and $11.5 billion in long-term debt.
Dividend: TGT pays an annual dividend of $3.60 per share, which translates to an annual yield that of about 1.43% at the stock’s current price.
Price/Book Ratio: there are a lot of ways to measure how much a stock should be worth; but I like to work with a combination of Price/Book and Price/Cash Flow analysis. Together, these measurements provide a long-term, fair value target around $132 per share. That means the stock is clearly overvalued, with -34% downside from its current price, and a practical discount price at around $106.
Technical Profile
Here’s a look at the stock’s latest technical chart.
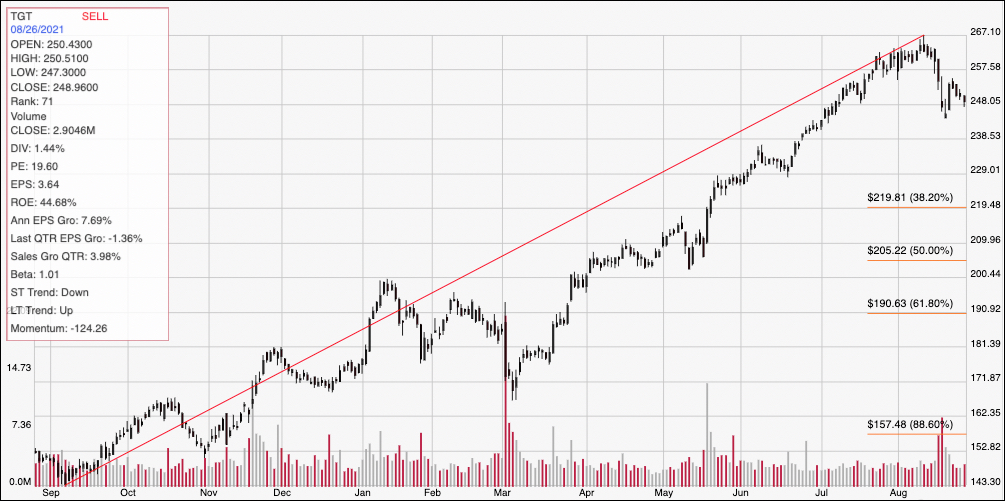
Current Price Action/Trends and Pivots: The chart above displays TGT’s price action over the last year. The red diagonal line plots the stock’s long-term upward trend from a September 2020 low at around $143 to its peak earlier this month at around $267. It also provides the baseline for the Fibonacci retracement lines shown on the right side of the chart. From its high, the stock has retraced about -7.5% lower, but appears to have a solid, current support level at around $244. Immediate resistance is at a recent peak at around $254. A push above $254 should give the stock room to test its 52-week high at $267, while a drop below support at $244 could have about $10 of downside before finding next support around $234.
Near-term Keys: Without a compelling value proposition right now (the stock’s realistic bargain value price is about $140 below the stock’s current price), the most interesting opportunities to work with TGT lie in the potential short-term trading opportunities it could offer. If the stock breaks above immediate resistance at $254, it could offer a useful signal to buy the stock or use call options using $267 as an interesting exit target. A drop below $244 would mark a drop below major support and would be a good signal to short the stock or buy put options, using $234 as a very practical bearish profit target.