There is a pretty significant difference in the way different investors perceive a stock in a long-term upward trend. For growth oriented-investors, the longer the upward trend, the more attractive the stock is, simply because the expectation is that the longer, bullish trend will outlast any near-term, bearish sentiment or momentum the stock may see. On the other hand, a stock in an upward trend – especially a long-term one – is something that leads value-oriented investors to shun it. That is especially true if, like me, they also tend to operate with a bit of a contrarian view of the world.
The challenge for value investors is that sometimes, a stock in a long downward trend has a very good reason for being where it is – sometimes, a cheap stock is just a cheap stock. Efficient market theory holds that in the broadest sense, the market is very good at pricing a company’s underlying fundamental weakness or strength into a stock’s price. That is often very much the case, which is why it is important to always be careful about considering a stock in a long-term downward trend for any kind of bullish position. It’s why I concentrate not only on a stock’s value proposition, but also make sure to run through a detailed view of the company’s business.
For stocks in long-term upward trends, efficient market theory holds that the most likely reason for the increase is the fundamental strength of the underlying business, which naturally attracts more investors to it. The problem with that notion for value investors is that, more often than not, a stock’s increase in price during a long-term upward trend tends to significantly outpace any increase or growth in the company’s actual business or improvement in the bottom line. If sales and earnings increase 10%, for example, a stock’s comparative increase in price will often be 2.5 to 3 times higher. At some point, the stock is simply too expensive to justify an investment.
The Mosaic Company (MOS) is a company in the Materials sector I’ve followed for some time that has followed the broad market over the past year, with an upward trend that from July of last year to a peak at the start of June saw the stock more than triple in value. From that peak above $38, however, the stock dropped more than -20%, running right around $30 through July. This month the stock has been trying to build some bullish momentum, and it looks like it could be ready to start break out of its recent consolidation range. Along with generally solid fundamentals that include improving liquidity and free cash flow, as well as a strengthening operating profile, this looks like a stock you should be paying to right now. Let’s dive in.
Fundamental and Value Profile
The Mosaic Company is a producer and marketer of concentrated phosphate and potash crop nutrients. The Company operates through three segments: Phosphates, Potash and International Distribution. The Company is a supplier of phosphate- and potash-based crop nutrients and animal feed ingredients. The Phosphates segment owns and operates mines and production facilities in Florida, which produce concentrated phosphate crop nutrients and phosphate-based animal feed ingredients, and processing plants in Louisiana, which produce concentrated phosphate crop nutrients. The Potash segment mines and processes potash in Canada and the United States, and sells potash in North America and internationally. The International Distribution segment markets phosphate-, potash- and nitrogen-based crop nutrients and animal feed ingredients, and provides other ancillary services to wholesalers, cooperatives, independent retailers and farmers in South America and the Asia-Pacific regions. MOS has a current market cap of about $12.3 billion.
Earnings and Sales Growth: Over the last twelve months, earnings increased more than 963.5% (not a typo), while revenues improved by nearly 37%. In the last quarter, earnings increased by a little over 105%, while sales grew by nearly 22%. The company’s margin profile has been healthy over the past year, and is showing signs of strength; Net Income as a percentage of Revenues improved from 14.25% over the last twelve months to 15.61% in the last quarter.
Free Cash Flow: MOS’s free cash flow over the last twelve months is $677.2 million. That’s an improvement over the last two quarters, when this number was $412 million in the last quarter of 2020. The current number also translates to a Free Cash Flow Yield of 5.46%.
Debt to Equity: MOS has a debt/equity ratio of .38. This is a conservative number. MOS currently has $1.4 billion in cash and liquid assets against about $4 billion in long-term debt. The company’s balance sheet indicates their operating profits are adequate to service the debt they have, with significantly strengthening liquidity, since cash and liquid assets were about $574 million two quarters ago.
Dividend: MOS’s annual divided is minimal, at only $.30 per share; that translates to a yield of just 0.92% at the stock’s current price.
Price/Book Ratio: there are a lot of ways to measure how much a stock should be worth; but I like to work with a combination of Price/Book and Price/Cash Flow analysis. Together, these measurements provide a long-term, fair value target at around $42 per share. That means that MOS is significantly undervalued, with 31% upside from its current price.
Technical Profile
Here’s a look at the stock’s latest technical chart.
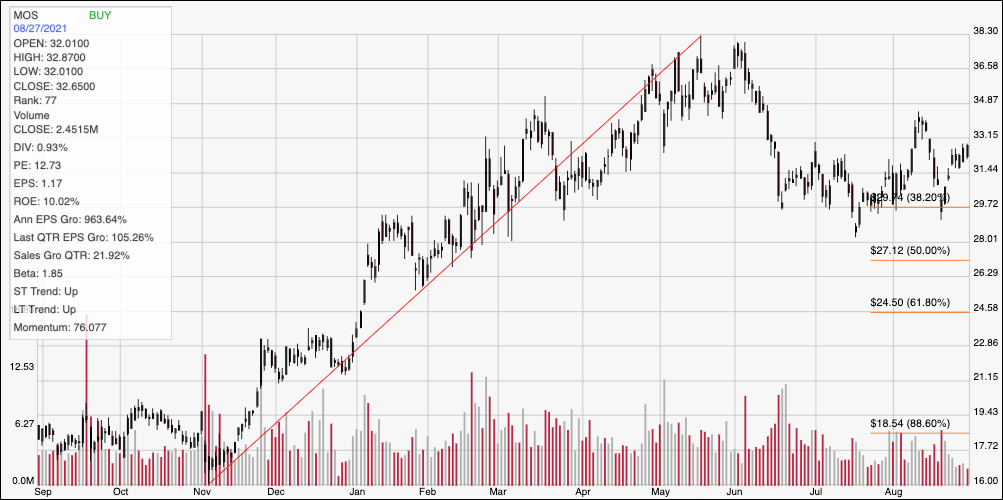
Current Price Action/Trends and Pivots: The red line on the chart above outlines the stock’s upward trend from November of last year to its peak at the beginning of June; it also informs the Fibonacci retracement levels on the right side of the chart. The stock’s drop in June found support at around $30 and began hovering in a narrow consolidation range, with $31.50 offering resistance until this month. The stock broke above that level last week, making $31.50 the new, current support level and putting immediate resistance at the stock’s peak earlier this month at around $34.50. A push above $34.50 should have upside to between $36.50 and its 52-week high a little above $38, depending on the strength of bullish momentum. A drop below $31.50 should see limited downside, with next support sitting right around $30, a little above the 38.2% Fibonacci retracement line.
Near-term Keys: MOS is building bullish momentum, and has seen its fundamentals improve enough in the last quarter to make the stock a very interesting value-based opportunity. If you prefer to focus on short-term trading strategies, the best probabilities are in bullish, momentum-based trades; use a push above $34.50 as a signal to buy the stock or to work with call options, using $36.50 to $38 as practical bullish profit targets. If you’re willing to work with very short-term price targets, a drop below $31.50 could be a signal to consider shorting the stock or buying put options, so long as you’re ready to take profits at around the $30 mark where next support should be found.