Over the last year or so, it has been interesting to see a number of normally unremarkable, under-the-radar stocks get a lot of attention in the marketplace for different reasons. Earlier this year, the so-called “meme stocks” were getting a lot of buzz, as investors used social media platforms like Reddit to compare notes about stocks that they thought institutions were being overly bearish about. The resulting surge in buying activity pushed companies like GameStop (GME), AMC Entertainment (AMC) and others to surge to unexpected highs from extremely low valuation levels.
The increase in buying activity was a little puzzling from a fundamental perspective, because at the time, these were companies that were among the most obvious losers during the pandemic. Highly reliant on foot traffic in malls and social gatherings in movie theaters, these were businesses on the verge of bankruptcy, which begged the question – which to my view, still remains unanswered about these companies – of the fundamental basis for those investments and the stock prices those stocks are still trading at.
Another stock that appears to have ridden a similar wave more recently is Big 5 Sporting Goods (BGFV). This a small-cap company that, as a retail sporting good retailer, relies heavily on the ability of consumers to come into their stores. At the beginning of 2021, the stock riding a modest upward trend to about $10 per share, but increased to about $18 by May, and then shot up by the beginning of June to a peak at nearly $38 per share. After sliding back to a support level at around $20, the stock picked up bullish momentum again toward the last couple of weeks of August, surging as of yesterday’s close to a little above $30 per share. News reports seem to be attributing the move to a “short squeeze,” the term applied to increasing buying activity spurred by short sellers who are scrambling to close losing positions by buying the stock back from the market.
Where BGFV differs from the “meme stocks” that dominated headlines earlier this year is in its fundamental profile. This is a company that operates with a purposely conservative approach reflected by very low debt, healthy liquidity, increasing Free Cash Flow, and a dividend payout that has been increasing throughout the last few quarters. The company’s latest earnings report – which came in early August before the buying frenzy started – also showed a strengthening operating profile that suggests that the company is on solid footing. What does the company’s fundamental strength say about its value proposition now, given the way the stock has been soaring? Let’s try to find out.
Fundamental and Value Profile
Big 5 Sporting Goods Corporation is a sporting goods retailer in the western United States. The Company offers a range of products in a sporting goods store format. The Company also offers products online through its e-commerce platform. The Company’s product mix includes athletic shoes, apparel and accessories, as well as a range of outdoor and athletic equipment for team sports, fitness, camping, hunting, fishing, tennis, golf, winter and summer recreation, and roller sports. The Company purchases merchandise from sporting goods equipment, athletic footwear and apparel manufacturers. It offers various brands, such as adidas, Coleman, Footjoy, JanSport, Rawlings, Spalding, Asics, Columbia, Franklin, Lifetime, Razor, Speedo, Bearpaw, Crocs, Gildan, Mizuno, Rollerblade and Timex. The Company operated 432 stores and an e-commerce platform under the name Big 5 Sporting Goods, as of January 1, 2017. BGFV has a current market cap of $718.1 million.
Earnings and Sales Growth: Over the last twelve months, earnings increased nearly 318% (not a typo), while sales improved by more than 43%. In the last quarter, earnings grew by almost 70% while sales increased by 19.5%. The company’s margin profile is healthy and strengthening; Net Income versus Revenue was 9.02% over the last twelve months, and improving to 11.29% in the last quarter.
Free Cash Flow: BGFV has healthy free cash flow of almost $173 million over the last twelve months. This number was also just $5 million at the beginning of this 2019, and $129.91 a year ago, making Free Cash Flow growth a useful benchmark for this stock. Their current Free Cash Flow number translates to a useful Free Cash Flow Yield of 27.75%.
Debt to Equity: the company’s debt to equity ratio is .02, which is very low and is reflected in the company’s balance sheet. As of the last quarter, cash and liquid assets were $119 million (an increase from $65 million two quarters ago), with just about $5 million in long-term debt. Along with the positive pattern of Free Cash Flow and their strengthening operating profile, BGFV has excellent, improving liquidity.
Dividend: BGFV pays an annual dividend of $1.00 per share, which translates to a very attractive annual yield of 3.6% at the stock’s current price. Their payout ratio is also conservative, at less than 25% of earnings. It should also be noted that management raised the dividend from $.72 per year after the last earnings report.
Price/Book Ratio: there are a lot of ways to measure how much a stock should be worth; but I like to work with a combination of Price/Book and Price/Cash Flow analysis. Together, these measurements provide a long-term, fair value target around $34 per share. That means that at the stock’s current price, it is only somewhat undervalued, with 6% upside from its current price, and a practical discount price at around $27 per share.
Technical Profile
Here’s a look at the stock’s latest technical chart.
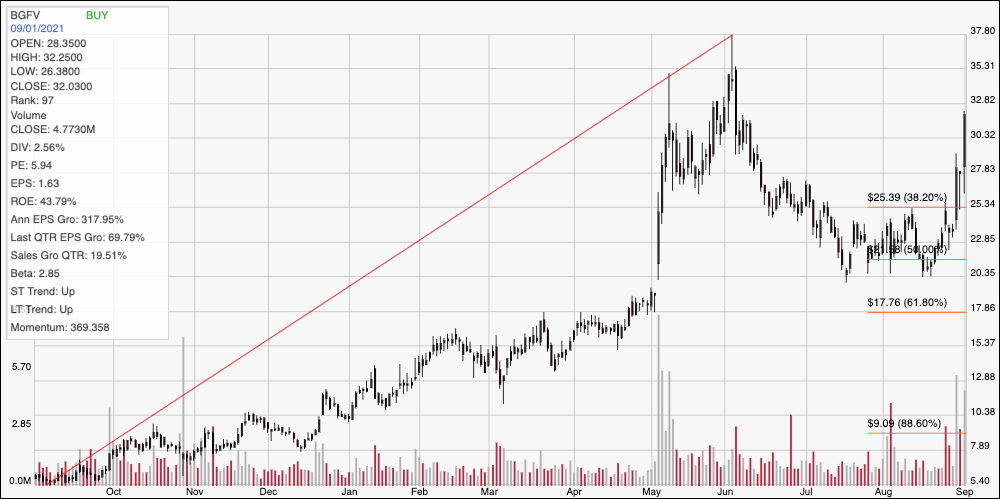
Current Price Action/Trends and Pivots: The chart above displays the stock’s price performance over the last year. The diagonal red line traces the stock’s upward trend from its low last September at around $5.40 to its June peak at around $38. It also informs the Fibonacci retracement lines shown on the right hand side of the chart. After dropping to around $20, the stock found support at around the 50% retracement and began to rally in the last couple of weeks of August, pushing above resistance at the 38.2% retracement line on Monday. Current support could be at around $30, a little below the stock’s current price, based on pivot activity around that level in May of this year; but if current bullish momentum reverses, and that support level doesn’t hold, the stock could fall to somewhere between $27 and $25 where the 38.2% retracement line sits. Given the strength of the stock’s current bullish momentum, immediate resistance could sit somewhere between $33 and $35, with additional upside to the stock’s high point at nearly $38 if buying activity continues.
Near-term Keys: BGFV’s fundamentals are very solid, and improving. I also think that the company offers products that are useful in any economic environment, and in particular could position this company well in a recovering economic climate. Given the massive increase in the stock’s volatility, however, there is an increasing risk that bullish investors could get caught in the opposite of a short squeeze; as short-term traders decide to lock in gains, increasing selling activity could force the stock to reverse lower even more strongly than the bullish move higher. That means that while the value proposition is interesting, long term upside is limited, which is why it might be smarter to wait and see if the stock drops to a more useful bargain price at around $27. If you prefer to work with short-term trading strategies, a push above $33 could offer a signal to buy the stock or to work with call options, using $35 to possibly $38 as useful profit targets depending on whether buying pressure continues. A drop below $30 should be taken as a signal to consider shorting the stock or to buy put options, using $27 to $25 as practical, short-term bearish profit targets.