In the Energy sector, there are a lot of different industries to think about, with a wide range of types of businesses related to it. It’s easy to correlate Energy to crude oil, because that is the single commodity that most of the companies in the sector are tied to in one way or another; but there are a lot of other product types that make up a significant part of this sector’s make up. One of those is natural gas liquids (NGL), which like crude itself have uses in a number of other segments of the economy such as petrochemicals, home heating, cooking and refrigeration, synthetic rubber for tires, vehicle fuel blends and more.
NGLs are an area that has experienced a growing level of exploration and production in the U.S., which means that companies that operate in this segment of the Energy sector, along with standard crude operations, have a useful second business leg to work from. Continued, increasing economic activity means energy demand should also stay elevated – and I think that includes demand for NGLs. That means that prices for Energy commodities, which have generally recovered from pandemic-driven disruptions and major declines, as well as picking up near-term momentum in the last couple of weeks, should remain at current levels or possibly even go higher. Many of the most interesting companies in this sector that have found a way to navigate difficult conditions of the last year did so in part by figuring how to operate successfully even amid depressed commodity prices, which means that healthy demand should boost these company’s profitability and long-term results even more.
Energy Transfer LP (ET) is a mid-cap company in the oil, gas & consumable fuels industry that focuses a primary portion of its business in natural gas assets, including storage facilities and transportation assets. This is a company whose balance sheet has been among the most healthy in its industry, even during the pandemic. After more than doubling in price from its 2020 low point at around $5 by mid-July, the stock has faded back into a short-term downward trend that at the end of August found a trend support low point looks set to reverse that trend. That means that along with a still-attractive value proposition, the stock also has a nice technical set up for a bullish trade, which is good either on a short-term basis or for a longer-term, value-focused investment.
Fundamental and Value Profile
Energy Transfer LP owns and operates a portfolio of energy assets. The Company’s operations include complementary natural gas midstream, intrastate and interstate transportation and storage assets; crude oil, natural gas liquids (NGL) and refined product transportation and terminalling assets; NGL fractionation; and various acquisition and marketing assets. Its segments include intrastate transportation and storage, interstate transportation and storage, midstream, NGL and refined products transportation and services, crude oil transportation and services, investment in Sunoco LP, investment in USAC, and all other. Through its intrastate transportation and storage segment, the Company owns and operates natural gas transportation pipelines and three natural gas storage facilities located in the state of Texas. Its intrastate transportation and storage segment focus on the transportation of natural gas to markets from various prolific natural gas producing areas. ET has a current market cap of $26.1 billion.
Earnings and Sales Growth: Over the last twelve months, earnings were nearly 54% higher, while sales increased almost 106%. In the last quarter, earnings declined by -82.5 while sales declined by -11%. On a quarter-to-quarter basis, earnings, Revenues, and even Net Income can be quite cyclical for stocks in this industry, and that is true the case of ET. The company’s margin profile over the last twelve months showed Net Income was 7.23% of Revenues, but weakened to 4.14% in the last quarter.
Free Cash Flow: ET’s Free Cash Flow is sign of significant strength, despite the weakening Net Income profile; over the last twelve months, this number was about $7.75 billion. That marks an improvement from $6.5 billion in the quarter prior, and $1.6 billion a year ago, and also translates to an impressive Free Cash Flow yield of 29.66%. The strength in this number i implies that the company’s ability to service its debt, maintain its dividend and keep business growing remains very healthy even though cash and liquid assets are limited.
Debt to Equity: ET has a debt/equity ratio of 1.54, which is generally higher than I prefer to see, but also not unusual for stocks in this industry. As of the last quarter, cash and liquid assets were $282 million versus $45.6 billion in long-term debt. Liquidity from cash and liquid assets is limited, however the company’s strong free cash flow is a good indicator of the company’s ability to service its debt without a problem.
Dividend: ET pays an annual dividend of $.61 per share, which at its current price translates to a dividend yield of about 6.32%.
Price/Book Ratio: there are a lot of ways to measure how much a stock should be worth; but I like to work with a combination of Price/Book and Price/Cash Flow analysis. Together, these measurements provide a long-term, fair value target at around $12.75 per share, which suggests that ET is nicely undervalued, with 32% upside from its current price.
Technical Profile
Here’s a look at the stock’s latest technical chart.
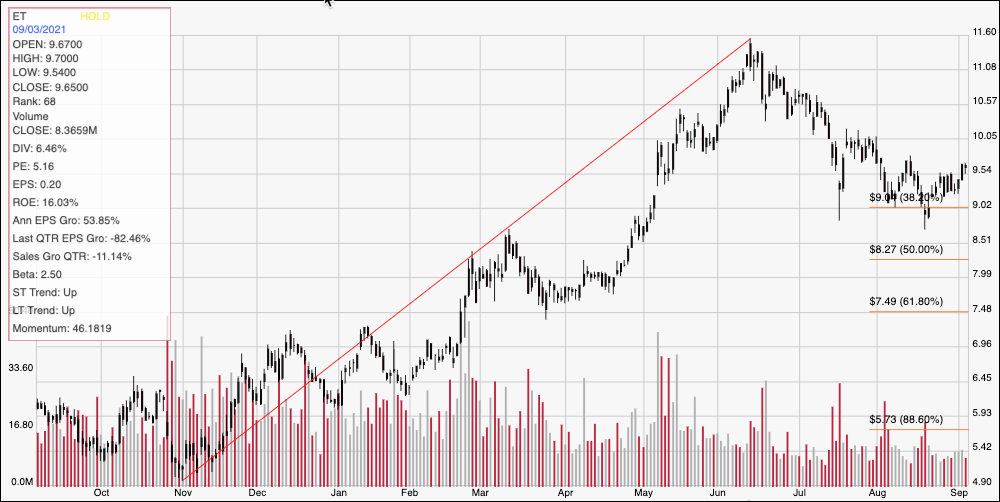
Current Price Action/Trends and Pivots: The chart above displays the last year of price activity for ET. The red diagonal line traces the stock’s upward trend from November 2020 at around $5 to its June high at around $11.60; it also provides the baseline for the Fibonacci retracement lines shown on the right side of the chart. The stock’s short-term downward trend from that high saw the stock touch the 38.2% Fibonacci retracement line at around $9 in mid-August before starting to stabilize, putting current support at that level, with immediate resistance at around $10 based on May and July pivot activity in that price area. A push above $10 should give the stock room to test its 52-week high at around $11.60, while a drop below $9 should find next support between $8 and $7.50 where the 50% and 61.9% retracement lines, respectively, lie in wait.
Near-term Keys: ET’s strong pattern of healthy Free Cash Flow over the last couple of quarters is a strong sign of fundamental strength that makes the stock’s current drop and short-term trend an attractive opportunity to start thinking about the stock in bullish terms. The current technical set up, in fact lends itself very nicely to short-term bullish trading opportunities, while bearish set-ups are very low-probability propositions with limited profit potential. Use a push above $10 as a signal to think about buying the stock or working with call options, using the stock’s June high at around $11.60 as a practical near-term bullish target price. If you are looking for a useful, value-focused, long-term investment opportunity, ET has an attractive dividend and very healthy pattern of Free Cash Flow growth that I think makes the stock worth taking very seriously.