One of the sources of a lot of conversation among talking heads and market analysts in general lies around the “reopening” concept. With social and business restrictions easing across the United States, many of the activities we all enjoyed prior to the global pandemic are coming back into a vogue. This seems to have remained a constant for most of the summer, even as pandemic-driven health concerns have resurfaced throughout much of the country.
Market enthusiasm and economic growth driven around the reopening of business and social activity should be a net positive for the Consumer Discretionary sector. The sector has shown quite a bit of resilience over the past year and a half, driven by a massive shift to e-commerce services and solutions. Among the pandemic-driven shifts that worked in the favor of a lot of different industries in the sector, including stocks in the Textiles, Apparel & Luxury Goods industry has been an increased focus on personal health and wellness. That is an industry that includes well-known players like Under Armour (UA), Nike (NKE), Hanesbrands Inc (HBI) and today’s highlight, Gildan Activewear (GIL). GIL doesn’t have the same cachet that comes from immediate name recognition, but is a very interesting stock because of its focus on private label apparel.
An increasing number of retailers are shifting the products they offer, increasing shelf and floor space in favor of brands offered only in their own stores. One of GIL’s strategic goals is on partnering with traditional retailers to manufacture those private label goods. It’s a trend that is expected to continue to grow, since private labels offer higher margins in the always-competitive retailing industry where margins are consistently thin and becoming even narrower – and where traditional brands like NKE, UA and more have been actively working to develop their own direct-to-consumer systems to bypass the traditional, more costly retail arrangement. GIL is a stock that has more than doubled in price over the last year, but more recently has dropped off of its latest 52-week high and how looks like it is setting up a classic, “buy the dip” kind of short-term opportunity. That’s interesting if your preference is on short-term trading strategies, but what kind of opportunity does this stock offer for longer-term investors – especially for contrarian-minded value hunters? Let’s find out.
Fundamental and Value Profile
Gildan Activewear Inc. is a manufacturer and marketer of branded basic family apparel, including T-shirts, fleece, sport shirts, underwear, socks, hosiery and shapewear. The Company operates through two segments: Printwear and Branded Apparel. The Printwear segment designs, manufactures, sources, markets, and distributes undecorated activewear products. The Branded Apparel segment designs, manufactures, sources, markets, and distributes branded family apparel, which includes athletic, casual and dress socks, underwear, activewear, sheer hosiery, legwear, and shapewear products, which are sold to retailers in the United States and Canada. The Company sells its products under various brands, including the Gildan, Gold Toe, Anvil, Comfort Colors, American Apparel, Alstyle, Secret, Silks, Kushyfoot, Secret Silky, Therapy Plus, Peds, and MediPeds brands. The Company distributes its products in printwear markets in the United States, Canada, Mexico, Europe, Asia-Pacific and Latin America. GIL’s current market cap is $7.6 billion.
Earnings and Sales Growth: Over the last twelve months, earnings increased by 168.7% (not a typo), while revenues were more 225% higher. In the last quarter, earnings increased by 41.67%, while sales increased by 26.73%. GIL operates with a margin profile that suffered during the pandemic – which isn’t a big surprise given the conditions – but has shown significant signs of improvement this year. Over the last twelve months, Net Income as a percentage of Revenues was 14%, and increased in the last quarter to 18.9%.
Free Cash Flow: GIL’s free cash flow is $664 million, and translates to a useful Free Cash Flow Yield of 8.69%. The current number also marks an improvement over the past year from about $330.5 million.
Dividend Yield: GIL’s dividend is $.616 per share, which translates to an annual yield of about 1.6% at the stock’s current price. Management suspended its dividend last year at the beginning of the pandemic, but reinstated it two quarters ago.
Debt to Equity: GIL has a debt/equity ratio of .37. This is a conservative number that generally implies management takes a careful approach to leverage. GIL’s balance sheet shows a little over $310.86 million in cash and liquid assets against about $500 million in long-term debt. GIL’s margin profile indicates operating profits are more than adequate to service their manageable debt load, with healthy liquidity to provide additional flexibility.
Price/Book Ratio: there are a lot of ways to measure how much a stock should be worth; but I like to work with a combination of Price/Book and Price/Cash Flow analysis. The “reopening” concept also provides a reasonable argument to factor expected growth rates into the equation, and I think that is applicable to GIL’s case. All together, these measurements provide a long-term, fair value target around $48 per share. That means that even with the stock’s increase in price over the last year, it remains nicely undervalued right now, with 23% upside from its current price.
Technical Profile
Here’s a look at the stock’s latest technical chart.
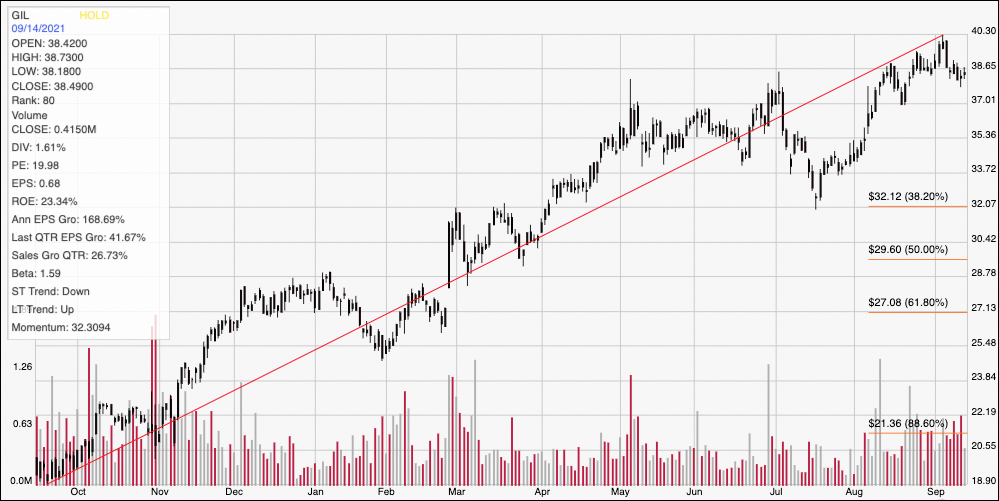
Current Price Action/Trends and Pivots: This chart traces the stock’s movement over the last year. The red line traces the stock’s upward trend since July of last year to its peak at around $40 at the beginning of this month; it also provides the baseline for the Fibonacci retracement lines shown on the right side of the chart. The stock appears to be stabilizing around $38, providing a good reference for current support at that level, with immediate resistance back at the stock’s peak a little above $40. A bounce off of current support has $2 of expected, short-term upside, with additional room into the $42 range if buying momentum remains strong. A drop below $38, on the other hand has limited downside, with next support expected to be at around $37 based on repeated pivot highs in that range in August, June, and May. If bearish momentum accelerates, a drop below $37 could have downside to about $34.
Near-term Keys: If you’re looking for a short-term, bullish trade, look for a bounce off of support at $38 as a good signal to buy the stock or to work with call options, with an eye on the stock’s recent peak at $40 as a useful exit target. If the stock shows weakness, and pushes below support at $37, consider shorting the stock or working with put options, with $34 providing a good profit target on a bearish trade. GIL is an interesting stock to pay attention to on a long-term basis; if the reopening scenario that so many experts are forecasting plays out as expected, the long-term upside for this stock could be well above its 52-week high.