Ever since coronavirus found its way to American shores, a lot of media attention has been given to the Healthcare sector – and especially to the Biotechnology industry, where many of the biggest names across the world have been working hard to develop effective treatments for the disease. Available vaccines are now available for distribution to most age groups except small children, even while there is plenty of push against vaccination from anti-vaccine supporters. Besides vaccines, anti-viral treatments also saw a significant push in development along with big demand.
Some of the names that showed early promise also received the most attention from analysts and media types, at least in the earliest stages of the pandemic. One of those companies is Gilead Sciences Inc. (GILD), a large-cap company with treatments for diseases such as HIV/AIDS, cancer, and other respiratory diseases. One of their antiviral drugs, remdesivir was originally created to combat the hepatitis C virus, but that demonstrated a benefit in clinical trials with hospitalized COVID patients – enough to gain emergency approval from the FDA, and to give the company a revenue stream that in 2020 represented approximately 12.5% of sales. Outside of COVID-19, the company has also been investing heavily since 2019 to bolster its drug pipeline, with its acquisition of Immunomedics providing a newly approved treatment for metastatic triple-negative breast cancer that was approved by the FDA earlier this year and is expected to generate $3.5 billion in sales by 2025. The caveat associated with remdesivir as a growth driver is that its long-term benefit is less clear; analysts point to the expectation that remdesivir sales will decline as pandemic concerns fade, but across the United States, COVID-19 transmission rates and hospitalizations continue to surge.
Some of the early news about remdesivir gave investors enough enthusiasm about GILD to push the stock from a February 2020 low around $62 to a peak a year ago at around $86. From that point, however, the company’s following earnings reports showed that, while the company has a healthy balance sheet, their capital expenditures – which certainly, and appropriately included a big push to fast-track remdesivir as a COVID treatment – put the company’s operating profile in net-negative territory. That was a strong enough concern to push the stock into a downward trend into the beginning of 2021 that saw it hit a trend low at around $56.50. From that low, the stock has staged a sizable new bullish trend that peaked in mid-August at around $73.50 before tapering back again. The beginning of this week saw the stock find support at around $70 and push higher strongly yesterday, in what could be a strong signal the the stock is poised to break its 52-week high and continue going even higher. That is interesting for momentum-driven, short-term traders, but what does it mean for value-oriented, long-term investors? Are the company’s fundamentals strong enough to still make the stock a useful value?
Fundamental and Value Profile
Gilead Sciences, Inc. is a research-based biopharmaceutical company that discovers, develops and commercializes medicines in areas of unmet medical need. The Company’s portfolio of products and pipeline of investigational drugs includes treatments for Human Immunodeficiency Virus/Acquired Immune Deficiency Syndrome (HIV/AIDS), liver diseases, cancer, inflammatory and respiratory diseases and cardiovascular conditions. Its products for HIV/AIDS patients include Descovy, Odefsey, Genvoya, Stribild, Complera/Eviplera, Truvada, Emtriva, Tybost and Vitekta. Its products for patients with liver diseases include Vemlidy, Epclusa, Harvoni, Sovaldi, Viread and Hepsera. It offers Zydelig to patients with hematology/oncology diseases. Its products for patients with various cardiovascular diseases include Letairis, Ranexa and Lexiscan. Its products for various inflammation/respiratory diseases include Cayston and Tamiflu. It had operations in more than 30 countries, as of December 31, 2016. GILD has a current market cap of $90 billion.
Earnings and Sales Growth: Over the past year, earnings increased almost 68.5%, while sales grew by nearly 21%. In the last quarter, earnings were -10% lower, while sales declined by -3.2%. At the end of 2020, GILD’s operating profile dipped into negative territory, but has stabilized and recovered strongly as of the most recent report; Net Income as a percentage of Revenues was 19.38% in the trailing twelve-month period and strengthened to 24.48% in the last quarter.
Free Cash Flow: GILD’s Free Cash Flow is generally healthy, at about $8.5 billion. On a Free Cash Flow Yield basis, that translates to 9.59%. It should be noted that this number has declined steadily since the beginning of 2016, when Free Cash Flow peaked at $19.5 billion, but has also improved from late 2019, when Free Cash Flow was about $6.6 billion. It is also sizably higher versus six months ago, from $7.5 billion.
Debt to Equity: GILD has a debt/equity ratio of 1.42, which is a bit higher than I prefer to see, and also reflects increasing debt the company has taken on, in part to complete its acquisition of Immunomedics; but by itself this number doesn’t really tell the whole story. Their balance sheet shows $6.5 billion in cash in the last quarter (down from $23.9 billion at the end of 2020) against $27.9 billion in long-term debt. The company’s operating profile suggests there should be no problem servicing its debt.
Dividend: GILD pays a dividend of $2.84 per share (up from $2.52 in 2019 and $2.72 last year), which translates to an annual yield of about 3.96% at the stock’s current price. Management’s ability to increase the dividend is a positive sign.
Price/Book Ratio: there are a lot of ways to measure how much a stock should be worth; but I like to work with a combination of Price/Book and Price/Cash Flow analysis. Together, these measurements provide a long-term, fair value target around $59 per share, which means that GILD is overvalued, with about -18% downside from its current price, and also puts the stock’s bargain price at around $47.
Technical Profile
Here’s a look at the stock’s latest technical chart.
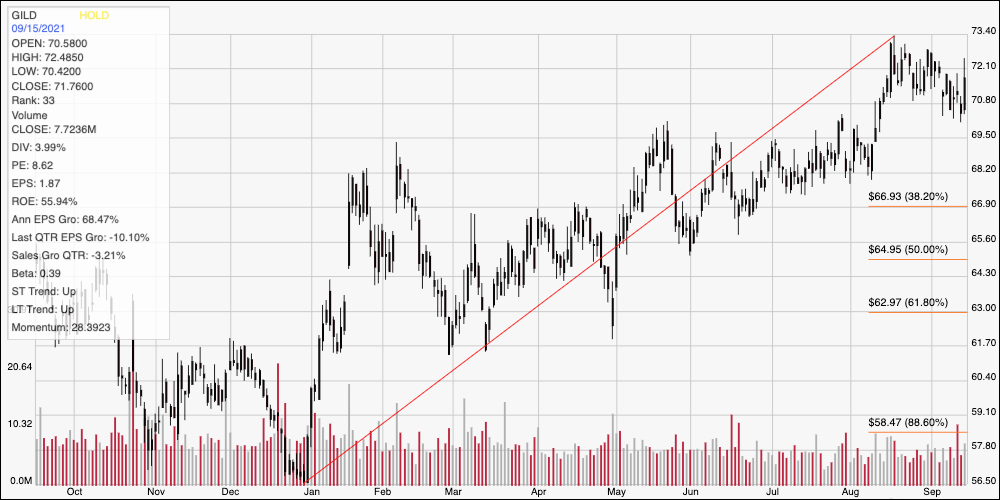
Current Price Action/Trends and Pivots: the chart above covers the last year of price activity for GILD. The diagonal red line traces the stock’s upward trend from its January low at around $56.50 to its August peak at around $73.50; it also provides the baseline for the Fibonacci retracement lines shown on the right side of the chart. The stock’s fade to current support at around $70 took almost a month, but gave the stock a strong springboard yesterday to rally higher, putting the stock within about $1.50 of its 52-week high and immediate resistance at $73.50. A push above that mark should see near-term upside to about $77, while a drop below $70 should find next support at around $68, with additional support just below that around $67 where the 38.2% retracement line sits also helping to limit the stock’s short-term downside.
Near-term Keys: Given GILD’s overvalued status, there isn’t any way to suggest the stock is a good value right now; however the current technical set up is strongly skewed to the bullish side, with sizably more upside potential than downside risk. That also means that the best probabilities lie not only with short-term trades, but also on the bullish side, with bearish trades offering very little probability of success. Use a push above $73.50 to consider buying the stock or working with call options, using $77 as a useful, practical bullish profit target.