Within the scope of long-term investing, there are two primary methods most investors use: investing for growth, or looking for value. I write a lot in this space about value-oriented investing, because more than two decades of study and hard experience have taught me that it is the investing method that suits me best. It also tends to steer me away from stocks that are at or near yearly or all-time highs. That’s because stocks that offer attractive value are usually trading at the lower end of its historical ranges – which helps to explain why most value-focused investors also tend to think in more than slightly contrarian terms about the market and the nature of trends.
Looking for stocks at the low end of their historical ranges generally increases the odds that the stock will represent a good bargain. That is especially true if the company’s fundamental profile is strong. Sometimes, an unexpected convergence between growth and value investing happens, where a stock that has been following an extended upward trend still offers a useful value. It’s pretty rare, but it does happen often enough that I’ve learned not to simply dismiss a stock due to its current price level without taking a deeper dive into what their book of business actually tells me about their value proposition.
Another interesting wrinkle comes when a stock that has been following a long-term upward trend falls back to levels technicians like to start calling “corrections.” These sometimes represent shorter-term downward trends that ultimately provide the stock’s longer-term trend an opportunity to reassert itself once the stock has dropped to what may be a more reasonable price. That becomes more interesting for growth and short-term, momentum-based investors as well as for value investors, providing a very interesting confluence of multiple investing methods all at the same time.
Buckle Inc. (BKE) may be just the kind of stock right now that I’m talking about. The stock has been following a long-term upward trend since recovering from its own pandemic-induced low point, but started dropping in July off of a multiyear high price. In fact, the stock has dropped almost -20% from that point, which is part of the reason that the stock’s price is starting to look more interesting. Diving into their fundamentals reveals a solid balance sheet, including increasing liquidity and Free Cash Flow, and an healthy operating profile. Management suspended the stock’s dividend payout temporarily last year, but resumed it in the last quarter of 2020, which is a strong sign of confidence in their ability to keep driving profitability and growth. Do those strengths also, still translate to a useful valuation given the stock’s strong performance over the past year and a half? Let’s find out.
Fundamental and Value Profile
The Buckle, Inc. is a retailer of casual apparel, footwear and accessories for young men and women. The Company operates approximately 446 retail stores in 42 states throughout the United States under the names Buckle and The Buckle. The Company markets a selection of brand name casual apparel, including denims, other casual bottoms, tops, sportswear, outerwear, accessories and footwear. The Company provides customer services, such as free hemming, free gift-wrapping, easy layaways, the Buckle private label credit card, and a guest loyalty program. Its offers denims from brands, such as Miss Me, Rock Revival, KanCan, Bridge by GLY, Flying Monkey, Levi’s, and Wrangler. Other brands include Hurley, Billabong, Affliction, American Fighter, Howitzer, Oakley, Fox, Obey, RVCA, Salvage, 7 Diamonds, Nixon, Free People, White Crow, Salt Life, Corral, Reef, Kustom, Timberland, SOREL, Hey Dude, Steve Madden, SAXX, Stance, Ray-Ban, Wanakome, Champion, Fossil, and G-Shock. BKE’s current market cap is $2.1 billion.
Earnings and Sales Growth: Over the last twelve months, earnings increased almost 46.5% while revenue grew by 36.6%. In the last quarter, earnings declined by -10.34%, while revenues dropped by -1.34%. The stock’s operating profile over the last twelve months is very healthy, with Net Income at 18.55% of Revenues, and dropping somewhat to 17.42% in the last quarter.
Free Cash Flow: BKE’s free cash flow is very healthy, at $301.35 million. This number translates to a healthy Free Cash Flow Yield of 15.58% and marks a big increase from the end of 2020 at $219.87 – although it did decline from the quarter prior, at $339.15 million.
Debt to Equity: BKE has a debt/equity ratio of 0, which is indicative of the fact the company operates with no debt. Their balance sheet also shows $415.31 million in cash and liquid assets – an increase from $393.85 million in the quarter prior.
Dividend: BKE pays an annual dividend of $1.32 per share, which translates to a yield of 3.21% at the stock’s current price.
Price/Book Ratio: there are a lot of ways to measure how much a stock should be worth; but I like to work with a combination of Price/Book and Price/Cash Flow analysis. Together, these measurements provide a long-term, fair value target around $31.50 per share. That means that despite the fundamental strengths I just described, and the stock’s intermediate-term downward trend, BKE is overvalued, with -23% downside from that fair value price, and a useful discount price at around $25 per share. It should also be noted, however that at the beginning of 2021, this same analysis yielded a “fair value” target price of $21.25.
Technical Profile
Here’s a look at the stock’s latest technical chart.
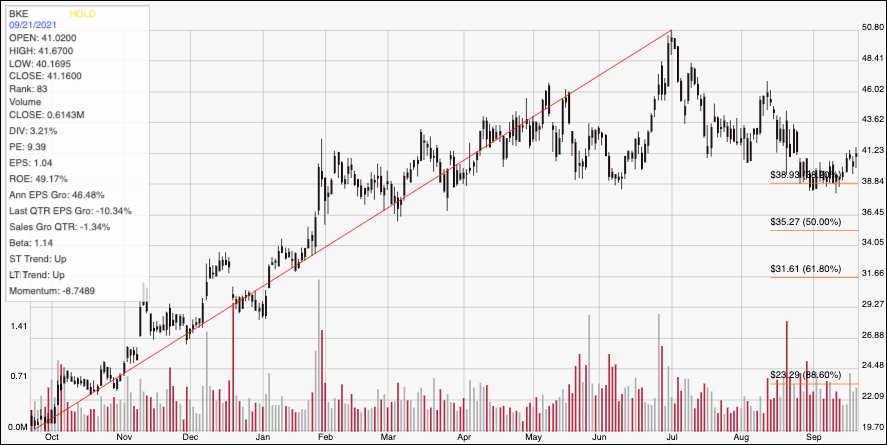
Current Price Action/Trends and Pivots: The chart above displays BKE’s price action over the past year. The diagonal red line traces the stock’s upward trend from a low point at around $15 to its July high at around $51 per share; it also provides the reference for calculating the Fibonacci retracement levels indicated by the horizontal red lines on the right side of the chart. From that July high, the stock has dropped into a downward trend that found a bottom at the beginning of this month at around $39 and inline with the 38.2% retracement line, and which acts as the stock’s current support level. In the last week or so, the stock has started to pick up some bullish momentum and is sitting right around immediate resistance a little above $41 per share. A continued push higher should see immediate upside to about $43.50 before finding next resistance, with additional room to $46 if bullish momentum increases. A reversal, and drop below $39 could see downside to anywhere between $36 and $34, and roughly inline with the 50% retracement line, depending on the pace of bearish momentum.
Near-term Keys: While BKE’s pullback over the last couple of months is interesting, it isn’t enough, unfortunately to also make the stock a useful value. I am encouraged by the fact that my fair value target has increased significantly this year, which is why, along with the company’s underlying fundamental strength, I think this is a stock to keep in your watchlist. For now, the best probabilities for working with this stock come from short-term trading strategies; a push above $41.50 could offer an interesting signal to buy the stock or work with call options, using a short-term target at $43.50 to $46 as a useful price area to take profits. A drop below $39, on the other hand could be a good signal to consider shorting the stock or buying put options, with $36 to $35 acting as a useful near-term profit target on a bearish trade.