One of the fairly consistent themes of 2021 has been the impact of the global pandemic on different pockets of the economy. While everybody is anxious to look past the days of social isolation, quarantine and shelter-in-place requirements at the early stages of the crisis, and talk about seeing life get “back to normal,” the plain truth is that it isn’t over. Even though the social restrictions that hamstrung the economy through a big portion of 2020 have generally not been enforced, it is also true that the longer the health care system is strained to the breaking point by continually high infections and hospitalizations, the longer the negative effect will carry over into other areas of the economy.
One pocket of the economy that really took a big hit is big-box department stores. While other specialty retailers found ways to adjust, absorb the negative impact that initial shutdowns imposed and emerge hopefully better equipped for the future, department stores like Kohl’s Corporation (KSS) were already struggling to adjust to shifting consumer preferences towards online shopping and reliance on private labels and brands before the pandemic began. KSS borrowed heavily to bolster its cash and liquid assets early during the pandemic, which enabled the company to absorb much of the blow they took from an extended shutdown period.
The company’s latest earnings report shows that a number of important fundamental metrics, including Free Cash Flow, cash and liquid assets and Net Income have all seen material improvements in the last few months. That could be a sign that the company has not only survived the worst, but also turned the corner to profitability and is in good position to respond to whatever conditions – good or bad – lie ahead. The stock hit a peak in May at around $65 per share before falling back to find a strong support level at around $50 that now appear to be giving the stock some bullish momentum in the last few days. From a value-based perspective, the stock’s valuation metrics have also seen significant improvement. Are all of these elements together enough to make the stock a useful value you should be thinking about right now? Let’s find out.
Fundamental and Value Profile
Kohl’s Corporation (Kohl’s) is an operator of department stores. The Company operates approximately 1,154 Kohl’s department stores, a Website (www.Kohls.com), approximately 12 FILA outlets, and approximately three Off-Aisle clearance centers. The Company’s stores and Website sell moderately-priced private label and national brand apparel, footwear, accessories, beauty and home products. The Company’s Website includes merchandise that is available in its stores, as well as merchandise that is available only online. The Company’s merchandise mix includes both national brands and private brands that are available only at Kohl’s. The Company’s private brands include Apt. 9, Croft & Barrow, Jumping Beans, SO and Sonoma Goods for Life. The Company’s exclusive brands include Food Network, Jennifer Lopez, Marc Anthony, Rock & Republic and Simply Vera Vera Wang. KSS’s current market cap is $8.3 billion.
Earnings and Sales Growth: Over the last twelve months, earnings increased by 1,092% (no, that isn’t typo), whiles sales increased a little more than 30.5%. In the last quarter, earnings grew by more than 136%, while sales also improved, by 14.4%. The company’s margin profile has historically been narrow, which does represent a risk element of which to be cautious. In the last twelve months, Net Income was 3.94% of Revenues, and strengthened to 8.59% in the last quarter. This is a turn to surprising strength that some analysts have described either positively as the effect of company efforts to manage costs, or negatively as a result of manipulation of aspects of the company’s cash flow like payment agreements with suppliers. I take the turn as a mostly positive sign, with an eye on the quarters ahead to see if the pattern continues or changes.
Free Cash Flow: KSS’s free cash flow is healthy, at $2.4 billion. That marks an increase from about $1.5 billion in the last quarter, and $1.275 billion a year ago. This is also a positive confirmation to the Net Income picture I just painted and translates to a Free Cash Flow Yield of nearly 30%.
Debt to Equity: KSS has a debt/equity ratio of .73. Cash and liquid assets increased by almost triple their level at the end of 2019, to a little more than $2.56 billion in the last quarter, while debt increased from $400 million in the middle of 2018 to nearly $1.9 billion in the most recent quarter. This number did decline from $3.4 billion in the quarter, which I think confirms their ability to pay down down debt (the company borrowed heavily at the onset of the pandemic, pushing long-term debt to more than $6 billion) while increasing liquidity is a big reason management announced the resumption of dividend distributions in the first quarter of 2021.
Dividend: KSS reinstated its dividend in the first quarter of 2021 at a rate of $1.00 per share, which translate to an annualized dividend yield of 1.81% at the stock’s current price.
Price/Book Ratio: there are a lot of ways to measure how much a stock should be worth; but I like to work with a combination of Price/Book and Price/Cash Flow analysis. Together, these measurements provide a long-term, fair value target around $63 per share. That suggests that the stock is undervalue right now by 14%. It should also be noted that in the last quarter, this metric put the stock’s fair value price at around $45 per share – so the improvement is significant, with a compelling bargain price at around $50 per share.
Technical Profile
Here’s a look at the stock’s latest technical chart.
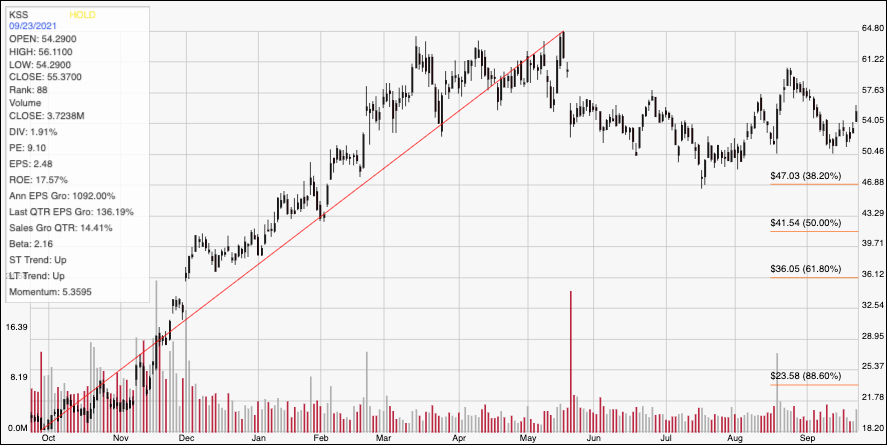
Current Price Action/Trends and Pivots: The chart above shows the last year of price movement for KSS. The red diagonal line traces the stock’s upward trend from an October low at about $18 to its peak around $65 in May. It also provides the baseline for the Fibonacci retracement lines shown on the right side of the chart. After falling back to a temporary support point at around $50.50 in July, the stock staged a short-term rally to $60 before dropping back again in the early part of September. In the last week or so, the stock has picked up bullish momentum again, using $50.50 for its latest support bounce to its current price around $55. Current support is now around $54, with immediate resistance at about $57.50. A push above $57.50 will find next resistance at the stock’s August peak around $60, while a drop below $54 should find next support, again, at around $50.50.
Near-term Keys: Despite KSS’s longer-term upward trend, the stock’s retracement into this month, along with its dramatically improving fundamental and valuation metrics strongly suggest the stock is now offering an interesting value to consider. Any kind of pause in the stock’s current bullish momentum would only improve that proposition even more. If you prefer to focus on short-term trading strategies, you could use a push above $57.50, as an interesting signal to consider buying the stock or working with call options, using $60 as practical profit target, and the stock’s May peak at $65 a possibility if bullish momentum accelerates. A drop below $54 should be taken as a sign to consider shorting the stock or buying put options, using a range between $50 and $47 per share as a good bearish profit target.