The longer a bull market lasts, the more extended price valuations become. The longer that condition continues, the harder it becomes for value-oriented investors to justify long-term investments in most of the stocks, industries and sectors that everybody else is talking about. I think this is a pretty good description of current market conditions, as valuations on stocks in a number of industries continue to sit at levels that become harder and harder to justify.
The irony of current market conditions is that the last couple of weeks provided what is now looking like another pullback from its latest 52-week high – which is what often acts as an extension of the longer-term upward trend, with a fresh set of highs against the backdrop of a global pandemic and all of the societal and economic difficulties associated with it. Economic activity that has continued to increase despite the pressure of increasing infections and hospitalizations is part of what prompted the latest pullback, as fears that increasing inflation would prompt the Fed to start raising interest rates. Higher unemployment claims in the last couple of weeks only added to the uncertainty.
One of the industries that you would expect to suffer during an economic downturn is Heavy Machinery. This is an industry in a sector, Industrials, that most analysts consider to be pretty cyclical; yet many of the largest companies in the sector – Caterpillar Inc. (CAT) and Deere & Co. (DE), for example – have followed the movement of the major indices to new, multiyear highs that would tempt you to believe that business is better than ever. That perception even extends to smaller competitors, like Terex Corp (TEX); this is a stock that has nearly quadrupled in price from its pandemic-prompted, bear market bottom at around $12 in the first quarter of 2020.
I think some of that action in these smaller companies comes from measures management may have to take to preserve capital and retain financial flexibility that larger companies may not have to take. In the case of TEX, slowdowns associated with the coronavirus pandemic prompted management to announce a suspension of its dividend, along with employee furloughs and reduced salaries for executives and cuts in production. The company’s earnings and Net Income through the last few quarters both reflect a significant impact from nationwide shutdowns and shelter-in-place orders, but also that they have not only survived that storm, but are in a good position to move with confidence into the future. That confidence is also manifest in the fact that earlier this year, management reinstated their dividend payout. What does that backdrop mean for the stock? After hitting a high in May at around $56, the stock has retraced to around $45. Is the decline enough to make the stock a good value? Let’s dive in and find out.
Fundamental and Value Profile
Terex Corporation is a manufacturer of lifting and material processing products and services that deliver lifecycle solutions. The Company has three business segments: Aerial Work Platforms (AWP), Cranes and Materials Processing (MP). It delivers lifecycle solutions to a range of industries, including the construction, infrastructure, manufacturing, shipping, utility, quarrying and mining industries. The AWP segment designs, manufactures, services and markets aerial work platform equipment, telehandlers and light towers. The AWP segment’s products are used by its customers to construct and maintain industrial, commercial and residential buildings and facilities, and for other commercial operations, as well as in a range of infrastructure projects. The Cranes segment’s products are used by its customers for construction and manufacturing facilities, among others. The MP segment’s products are used by its customers in construction, infrastructure and recycling projects. TEX’s current market cap is $3.1 billion.
Earnings and Sales Growth: Over the last twelve months, earnings increased more than 2,140% (not a typo) while revenues rose nearly 50.5%. In the last quarter, earnings were 82% higher, while sales were 20.19% higher. TEX operates with a historically narrow margin profile that has rebounded from negative territory in the last few quarters.. In the last twelve months, Net Income was 3.98% of Revenues, and strengthened to 7.11% in the last quarter. Narrow margins are not unusual in the Heavy Machinery industry, and given the nationwide shutdown of business operations from COVID-19, the improvement earlier this year from negative Net Income is very encouraging.
Free Cash Flow: TEX’s free cash flow spent most of 2020 and the early part of this year under pressure has been strengthening steadily since. Over the last twelve months, Free Cash Flow was $438.7 million – up from $71.8 million a year ago, but still significantly below the $1.3 billion level of the last quarter of 2019. The current number translates to a healthy Free Cash Flow Yield of 14.45%.
Debt to Equity: TEX has a debt/equity ratio of .86, a number that suggests a conservative approach to debt management. Their balance sheet shows $542 million in cash and liquid assets against about $888.5 in long-term debt. It is worth noting that earlier this year, long-term debt was $1.16 billion, making the reduction significant.
Dividend: TEX resumed its dividend payout earlier this year at $.48 per share, per year. At the stock’s current price, that translates to a dividend yield of 1.1%, which doesn’t sound too impressive; but the reinstatement in and of itself is a significant indication of management’s confidence moving forward.
Price/Book Ratio: there are a lot of ways to measure how much a stock should be worth; but I like to work with a combination of Price/Book and Price/Cash Flow analysis. Together, these measurements provide a long-term, fair value target at about $44 per share. That means the stock is fairly valued at its current price, with a discount price sitting back at around $35 per share.
Technical Profile
Here’s a look at the stock’s latest technical chart.
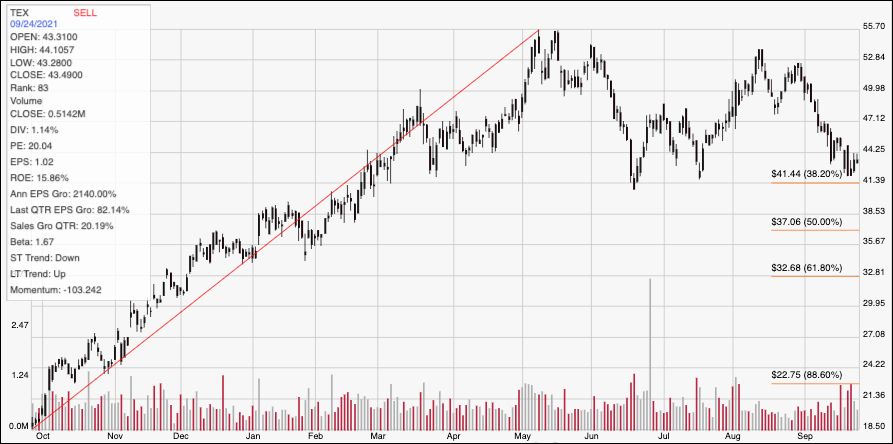
Current Price Action/Trends and Pivots: The red diagonal line measures the length of the stock’s upward trend from December of 2020 to its peak in May at around $56. It also provides the baseline for the Fibonacci retracement levels shown on the right side of the chart. In the last week, the stock has fallen to what should be major, current support at around $41.50, inline with the 38.2% retracement line, and started to bounce higher. Immediate resistance is around $47 based on pivot activity in that region in late June and early July. A push above $47 should give the stock room to rally to around $50 in the near-term, with $53 possible if bullish momentum increases. A drop below $$41.50 should find next support somewhere between $38.50 and $37 where the 50% retracement line sits.
Near-term Keys: The balance sheet for TEX has held up well for the past year, considering the challenges the company has been dealing with, and is a sign of management’s strength. Gains in Free Cash Flow and improving flexibility in the form of decreasing, manageable debt with healthy liquidity are also a positive along with the reinstatement of the stock’s quarterly dividend. Even with those strengths, however the stock is only fairly valued, meaning that it would have to drop to around $35 before I would consider it as a useful value opportunity. That also means the best probabilities lie with short-term trades. Use a push above resistance at $47 as an opportunity to think about buying the stock or working with call options, with a near-term target price at the stock’s last peak around $50. A drop below $41.50 might be a good signal to consider shorting the stock or buying put options, with next expected support at around $38.50 offering a useful profit target on a bearish trade.