One of the biggest themes that just about all of us have been paying attention to in one way or another in 2021 is the reopening of social activities from 2020, COVID-driven shutdowns and restrictions. While the pandemic is far from over, previously hampered industries like restaurants, hotels, travel and resorts have resumed operations, with signs of increasing consumer engagement in most of those pockets of the economy that have kept broad economic activity increasing.
Another beneficiary of the “reopening” idea is the Auto industry. New auto sales had dropped in 2019, and collapsed even further in 2020, but throughout the year just about every auto brand sold in the U.S. has seen healthy increases that are broadly expected to continue in 2022. That’s generally good news not just for automakers, but also for the businesses that support the industry.
MGA is a Canadian company whose biggest customers are the Detroit Big Three automakers. And while they’ve taken their lumps with the rest of the industry and the market, their balance sheet has been impressively resilient. They are also among the few companies in the industry that managed to maintain their dividend payout throughout the past year and a half, and also have enough of a presence in the electrical vehicle (EV) market to see positive impacts from that continued, emerging auto trend.
The stock enjoyed a massive run up in price from its March 2020 low at around $23 to a high in June of this year above $104. From that point, the stock has dropped back more than -25% to its current price around $77 per share. The question, of course, is whether their overall fundamental strength, with that attractive dividend, and the stock’s drop back is enough to also make the stock a good value? Here are the numbers.
Fundamental and Value Profile
Magna International Inc. (Magna) is a mobility technology company. The Company’s segments include Body Exteriors & Structures, Power & Vision, Seating System and Complete Vehicles. Its product capabilities include body, chassis, exterior, seating, powertrain, active driver assistance, electronics, mirrors & lighting, mechatronics and roof systems. Its products include sealing systems, sliding folding and modular roofs, active aerodynamics, lightweight composites, fuel systems, engineered glass, body systems, electronic controllers, interior mirrors, exterior mirrors, tail lamps, small lighting, seat structures, door systems, power closure systems, mechanism & hardware solutions, foam & trim products, complete vehicle manufacturing, engineering services and fuel systems. MGA has a current market cap of about $23 billion.
Earnings and Sales Growth: Over the last twelve months, earnings increased nearly 182%; Revenues also increased by 110.5%. In the last quarter, earnings dropped by almost -25%, while sales were -11.25% lower. MGA’s operating profile has historically been narrow, with signs of weakening in the last quarter; Net Income versus Revenues was 4.69% in the last quarter, versus 4.69% over the last twelve months.
Free Cash Flow: MGA’s free cash flow is healthy, at almost $3.8 billion. This number has been somewhat cyclic from one quarter to the next, but has shown a general, upward stair-step pattern of growth going back to the last quarter of 2016. It also translates to a very attractive Free Cash Flow Yield of about 16%.
Dividend: MGA pays an annual dividend of $1.72 per share, which translates to an annual yield of 4.35% at the stock’s current price. The company has also increased the dividend from $1.32 per share, per year steadily since late 2018, and which includes an increase from $1.60 per share at the beginning of 2021. That is a strong indication of management’s confidence in their business.
Price/Book Ratio: there are a lot of ways to measure how much a stock should be worth; but I like to work with a combination of Price/Book and Price/Cash Flow analysis. Together, these measurements provide a long-term, fair value target around $95 per share. That suggests that MGA is undervalued by 25% from its current price around $77.
Technical Profile
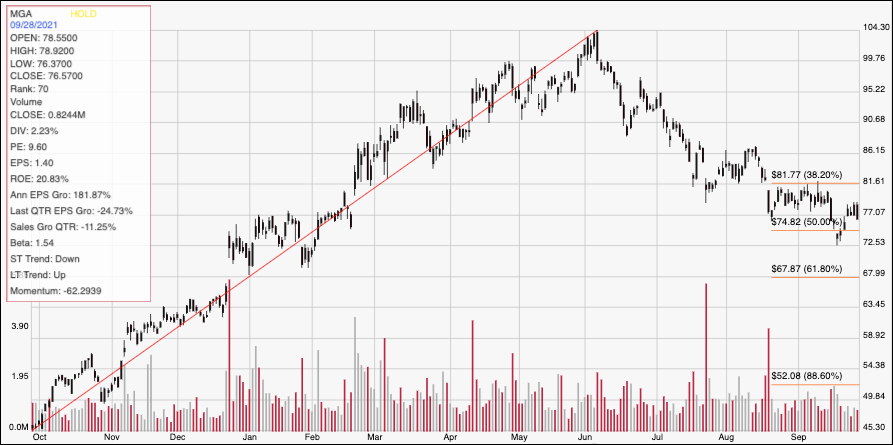
Here’s a look at the stock’s latest technical chart.
Current Price Action/Trends and Pivots: The chart above displays the stock’s price activity over the past year. The red diagonal line traces the stock’s upward trend from October of last year to its peak in June above $104. It also provides the basis for the Fibonacci retracement lines on the right side of the chart. The stock slid back below the 38.2% retracement line in late August and began to consolidate around that area before broad market uncertainty last week pushed the stock a little below the 50% retracement line at around $72.50. From that point, the stock has rebounded to the bottom of its August consolidation range, with current support between $75 and $77 and immediate resistance at about $82. A push above $82 should have upside to about $86 in the near term, while a drop below the 50% link at $75 should find next support at around $72.50; however if bearish momentum accelerates, next support is around $68 where the 61.8% retracement line sits.
Near-term Keys: If you’re looking for a short-term bullish trading setup, you can take a bounced off support at $77 as a signal to buy the stock or work with call options, with an eye on $82 as a practical bullish profit target. A push below $75 would act as a signal to short the stock or to consider buying put options, with a bearish profit target between $72.50 and $68, depending on the pace of bearish momentum. I expect near-term conditions for the stock to remain volatile, which means that even though the stock’s fundamentals are solid, and the value proposition is compelling, this is a stock you would have to be willing to take a long-term perspective with.
