Throughout the past year and a half, stocks in the Health Care sector have drawn a lot of attention from investors and analysts. That includes stocks in the Pharmacy/Drugstore industry; these were names, like Walgreens Boots Alliance (WBA) and CVS Corporation (CVS) that worked actively in the early stages of the crisis to provide a critical piece of the testing puzzle, providing COVID-19 testing spaces outside its stores with solutions that included drive-through tests. As vaccine candidates moved from trial to emergency use authorization and to FDA approval, they’ve also helped provide the next piece of the puzzle as a place you could go to get vaccinated.
In the U.S., intense competition has spurred major consolidation among recognized national pharmacies, leaving just CVS and WBA standing and looking for ways to innovate to counter not only the competition from each other but also from other companies like Amazon, WalMart, and Costco, to name just a few. CVS is actively renovating and remodeling local retail locations into combined pharmacy and health care service centers in the form of MinuteClinic and HealthHUBs; WBA isn’t standing pat either, investing heavily to roll out full-service primary care clinics as part of a partnership with VillageMD.
Long-term demographic trends are generally favorable for pharmacies, even outside the scope of the pandemic. Continued aging of the Baby Boomer generation, with Generation X following not far behind in the next decade or two, means that demand for prescription drugs and related health care services is expected to only increase. When you add in other fundamental factors like WBA’s long-standing status as a dividend aristocrat (members of the S&P 500 Index that have paid a dividend for 25 consecutive years or more) and healthy Free Cash Flow, it is interesting to look at the stock’s price performance.
While most stocks in the Healthcare sector (including CVS) saw a nice rebound beginning in March of last year, along with the rest of the market, WBA’s stock extended a multiyear downward trend that saw the stock touch a new low around $33 in November 2020. From that point, the stock has since picked up a lot of bullish momentum, increasing in price to an April peak above $57 per share. In the six months since, the stock has dropped back to what looka like a useful consolidation level around $46 per share. With some interesting strengths in the company’s fundamental profile, the natural question to ask is whether the stock’s latest price activity also translates to a useful value proposition. Let’s find out.
Fundamental and Value Profile
Walgreens Boots Alliance, Inc. is a holding company. The Company is a pharmacy-led health and wellbeing company. The Company operates through three segments: Retail Pharmacy USA, Retail Pharmacy International and Pharmaceutical Wholesale. The Retail Pharmacy USA segment consists of the Walgreen Co. (Walgreens) business, which includes the operation of retail drugstores, care clinics and providing specialty pharmacy services. The Retail Pharmacy International segment consists primarily of the Alliance Boots pharmacy-led health and beauty stores, optical practices and related contract manufacturing operations. The Pharmaceutical Wholesale segment consists of the Alliance Boots pharmaceutical wholesaling and distribution businesses. The Company’s portfolio of retail and business brands includes Walgreens, Duane Reade, Boots and Alliance Healthcare, as well as global health and beauty product brands, including No7, Botanics, Liz Earle and Soap & Glory. WBA has a current market cap of $40.7 billion.
Earnings and Sales Growth: Over the last twelve months, earnings increased by almost 82%, while sales were -1.74% lower. In the last quarter, earnings improved by 7.86% while sales increased 3.82%. The company’s margin profile is normally razor-thin, but is showing useful signs of improvement; over the last twelve months Net Income was 1.56% of Revenues. In the last quarter, Net income strengthened 3.52% in the last quarter.
Free Cash Flow: WBA has free cash flow of a little over $5.8 billion over the last twelve months. This number has declined from August of 2018, when it was about $6.9 billion; but it also marks a sizable improvement from a year ago, when Free Cash Flow had declined to about $4.8 billion. The current number also translates to a healthy Free Cash Flow Yield of 14.39%.
Debt to Equity: the company’s debt to equity ratio is .34, which is a conservative number. Long-term debt in the last quarter was almost $7.7 billion versus $1.35 billion in cash and liquid assets. Liquidity is improving, as cash was $469 million about a year ago. The company’s narrow, but strengthening margin profile along with improving liquidity suggests debt management should not be a concern.
Dividend: WBA pays an annual dividend of $1.91 per share, which translates to an annual yield of 4.09% at the stock’s current price. WBA also increased their dividend from $1.87 per share following their latest earnings announcement – which is a sign of strength and a confirmation of the company’s status as a Dividend Aristocrat.
Price/Book Ratio: there are a lot of ways to measure how much a stock should be worth; but I like to work with a combination of Price/Book and Price/Cash Flow analysis. Together, these measurements provide a long-term, fair value target around $58 per share. That means the stock is nicely undervalued, with about 23% upside from its current price.
Technical Profile
Here’s a look at the stock’s latest technical chart.
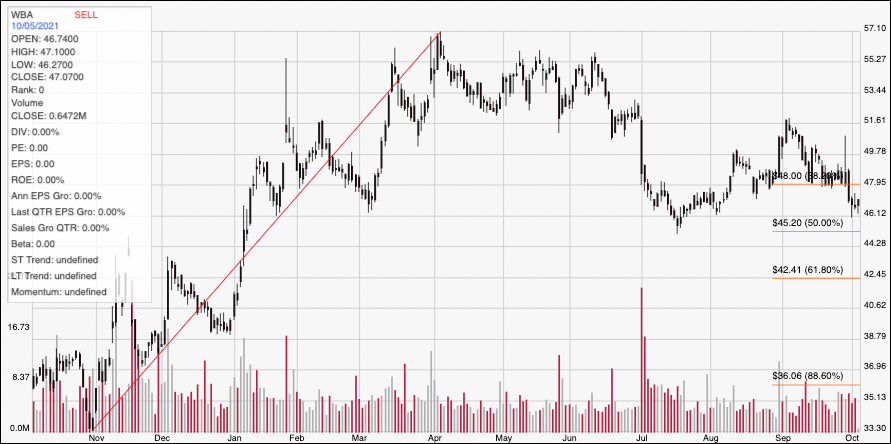
Current Price Action/Trends and Pivots: The chart above displays the stock’s price activity over the last year; the diagonal red line traces the stock’s upward trend from a late October low at around $33 to its recent high a little above $57. It also provide the baseline for the Fibonacci retracement lines shown on the right side of the chart. The stock dropped to around the 50% retracement line in July at about $46 per share, and staged a short-term rally from that point that failed in September and has since seen the stock drop back to that $46, current support level. Immediate resistance is at around $48 based on pivot activity this month right around the 38.2% retracement line. A push above $48 should see near-term upside to between $50 and $51.59, where the stock’s September peak occurred, while a drop below $46 could have downside to about $42 where the 61.8% retracement line sits.
Near-term Keys: WBA’s valuation metrics are very useful right now, which means that along with the company’s improving fundamentals, this is a smart stock to pay attention to and consider as a long-term investing opportunity. If you prefer to focus on short-term trades, you could use a drop below $46 as a signal to consider shorting the stock or working with put options, with an eye on a profit target around $42. If the stock can bounce off of current support move higher, there could be an interesting signal to buy the stock or work with call options, using immediate resistance at $48 as a useful, quick-hit, bullish profit target, and $50 to $51.50 possible if buying momentum increases.