The Food Products industry in the Consumer Staples sector is an area of the market that tend to get overlooked because, let’s face it, it just isn’t very sexy. Even so, it is one of very few segments of the market that saw consumer-driven improvements in demand during the pandemic. That gave a lot of companies in the industry a lot of strength versus stocks in trendier industries. It is also a trend that has a lot of analysts and economists arguing about its “stickiness” – meaning that what may have initially been a natural reaction to extreme conditions could constitute a long-term change in consumer behavior.
“Stickiness” means that the longer consumers rely on cooking and eating at home, the more likely that behavior is to become ingrained. That doesn’t mean we as consumers don’t appreciate the opportunity to go out and enjoy the socialization associated with restaurants, theaters, and so on. Even so, I think food-at-home is something that will stick as a natural behavior for fiscally conservative families, even as many of the restrictions that prompted this trend have been lifted and we can begin enjoying social gatherings and other activities. One of the headwinds the Food Products has encountered this year, however, are supply chain issues that have included limited labor to return to full capacity. These have led to cost increases that have seen their way to consumer prices, and so could limit growth through the rest of the year and into 2022.
Another interesting layer of the stay-at-home trend relates to pets. Pet food is a highly competitive segment of the Food Products industry, but something that analysts like to see as part of a diversified company portfolio. A secondary increase in demand in pet food is likely to see very healthy stickiness because of increased pet purchases and adoptions in the last year. Makes sense, doesn’t it? Being forced to stay at home, which earlier this year included having parents with young children begin schooling at home, means that the emotional support offered by a cuddly puppy or kitty becomes more compelling. That means that the Food Products companies that have pet food and pet products as part of their business portfolio have a useful second leg to keep revenues healthy on a long-term basis.
While Consumer Staples stocks aren’t immune from market momentum, and can certainly turn lower with the rest of the market, they also typically display lower volatility characteristics than the most buzz-worthy stocks. That’s why this industry has always made a lot of sense to me as a way to add a conservative, defensive-oriented element to my portfolio. General Mills, Inc. (GIS) is a stock that I’ve followed for quite some time, and even used on a few different occasions over the last couple of years in my value-based, income-oriented investments. Its usefulness as a defensive position was proven out in 2020, as the stock dropped only about -10% during the initial broad market push to bear market levels, but then pushed more than 22% above its pre-pandemic highs by the beginning of August of last year. The stock managed to push to a new 52-week high in May at around $65 before sliding back again until September to a low point at around $57. Since then, the stock has regained bullish momentum that has countered the broader trend for Food Products stocks over the last few months, and how has the stock a little above $60. Does that mean that, along with its strong fundamental profile, its short-term pattern could be providing an interesting opportunity to take advantage of market momentum; and if so, does it also still offer an interesting value proposition? Let’s find out.
Fundamental and Value Profile
General Mills, Inc., is a manufacturer and marketer of branded consumer foods and pet food products sold through retail stores. The Company is a supplier of branded and unbranded consumer food products to the North American foodservice and commercial baking industries. It also provides pet food products through its subsidiary Blue Buffalo Pet Products Inc. The Company has four segments: U.S. Retail, International, Pet operating, and Convenience Stores and Foodservice. The Company offers a range of food products with a focus on categories, including ready-to-eat cereal; convenient meals, including meal kits, ethnic meals, pizza, soup, side dish mixes, frozen breakfast and frozen entrees; snacks, including grain, nutrition bars and frozen hot snacks; yogurt, and super-premium ice cream. The Company’s other product categories include baking mixes and ingredients, and refrigerated and frozen dough. It also provides food products for dogs and cats. GIS’s current market cap is $37.2 billion.
Earnings and Sales Growth: Over the last twelve months, earnings declined -1%, while revenues moved 4% higher. In the last quarter, earnings were 8.79% higher, while sales were flat, but positive at 0.36%. GIS operates with a healthy margin profile that has strengthened in the last few months; over the last year, Net Income was 12.72% of Revenues, and increased in the last quarter to 13.81%.
Free Cash Flow: GIS’s free cash flow is generally healthy, at about $2.25 billion, and translates to a Free Cash Flow Yield of 5.99%. This marks a decline from the quarter prior, when Free Cash Flow was $2.45 billion, and $3.19 billion three quarters ago. The fade in Free Cash Flow serves as a red flag that bears watching in the quarters ahead.
Dividend Yield: GIS’s dividend is $2.04 per share, and translates to an annual yield of about 3.28% at the stock’s current price. It is also worth noting the company increased their dividend in 2020 – a rarity in the market last year – from $1.96 per share.
Debt to Equity: GIS has a debt/equity ratio of 1.03. High debt/equity is pretty typical of stocks in the Food Products industry, and in this case GIS’ ratio is indicative in part of the debt the company assumed to complete the acquisition of Blue Buffalo Pet Foods in 2018. Their balance sheet shows liquidity, which had weakened through most of 2019, but improved through most of 2020 and the first part of this year has also faded; in the last quarter, cash and liquid assets were a little over $710 million. This number was about $532.7 million at the beginning of 2019 and $626 million in February 2020 before the pandemic began, but rose to $2.75 billion in the first quarter of 2021. They also currently have almost $10.3 billion of long-term debt. The company’s margin profile indicates that they should have no problem servicing their debt; but declining Free Cash Flow and deteriorating liquidity should not be ignored as warning signs.
Price/Book Ratio: there are a lot of ways to measure how much a stock should be worth; but I like to worth with a combination of Price/Book and Price/Cash Flow analysis. Together, these measurements provide a long-term target at about $57 per share. That suggests GIS is overvalued by -8%, with a practical bargain price for the stock at around $45.50 per share. It should also be noted that at the beginning of the summer, this same analysis yielded a Fair Value target of $62.50 per share.
Technical Profile
Here’s a look at the stock’s latest technical chart.
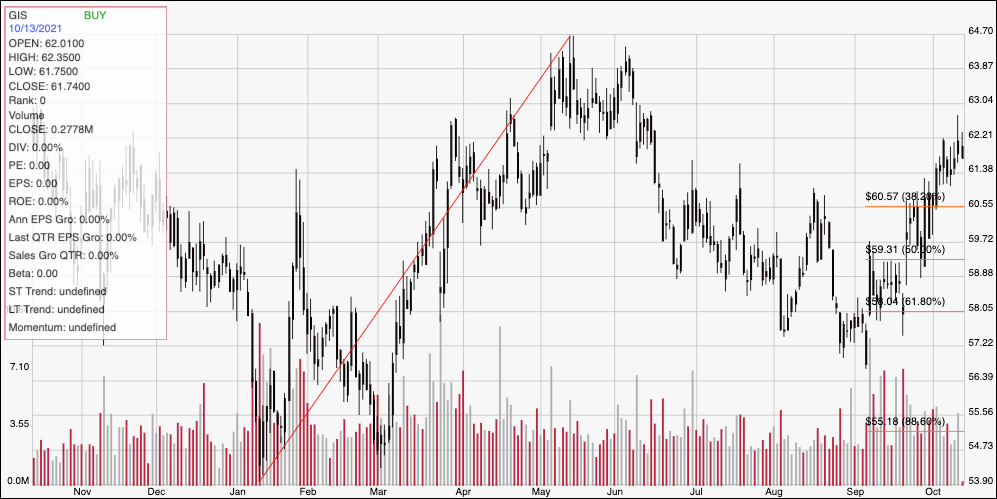
Current Price Action/Trends and Pivots: This chart traces the stock’s movement over the last year. The red diagonal line marks the stock’s upward trend from a January low at around $54 to its May high at nearly $65. It also provides the baseline for the Fibonacci retracement lines shown on the right side of the chart. After fading back to about $57 in early September, the stock picked up a lot of buying activity, which has pushed the stock to its current level around $62. Current support is around $61 based on pivot activity in March and April, with immediate resistance at around $63. A push above $63 should give the stock room to test its 52-week high near $65, while a drop below $61 should have limited downside, with strong support expected at the 38.2% retracement line, which is around $60.50. If selling pressure increases, however, and these first two support levels don’t hold, the stock could drop to anywhere between $59 and $58, where the 61.8% retracement line sits.
Near-term Keys: If you’re looking for a short-term, bullish trade, you could use a push above $63 as an opportunity to buy the stock or work with call options, using $65 as a useful profit target. A drop below $61, on the other hand has limited downside; but if the stock doesn’t hold above $60.50, you could take that as a signal to consider shorting the stock or buying put options, with a useful target price in the $58 range on a bearish trade. From a fundamental, value-oriented perspective, GIS offers a generally healthy balance sheet and interesting dividend; but declines in critical operating metrics – namely, Free Cash Flow and available Cash – are significant enough red flags to agree with the idea that the stock offers a better value proposition at a lower price, and it’s a smart idea to wait to see if the stock approaches that level or if the fundamentals improve in quarters ahead.