One of the things that always seems to be a little bit ironic to me about the markets is the way that fear tends to weave a web of intrigue and uncertainty under just about all conditions. That often means that when the market starts to correct, investors, analysts and economists don’t just look for the reasons behind the correction, but also start to fret about how bad things are really going to get. It also means that when things are going well, those same groups wring their hands about how long it will last and when the tide will turn.
Over the course of 2021, as economy has started to pick up, I’ve seen an increasing amount of commentary among analysts and economists about the pace of inflation, and whether expected, pent-up demand from long restrictions on social gatherings and activities was going to lead the economy to heat up much faster than economists and the Federal Reserve had anticipated. That raises the question of whether the Fed might be forced to start raising interest rates earlier than it had previously planned. While demand has picked up, indicators don’t seem to suggest that it has reached levels seen prior to the pandemic; however inflationary concerns persist, primarily because one of the extended effects of the pandemic has been its impact on employment. It could also be a symptom of federal aid policies dating back to 2020 that paid unemployed workers extra benefits to compensate for being furloughed or laid off during the pandemic, but have only begun to end in the last couple of months. Many conservative-leaning economists have argued those benefits were extended far too long, paying more for workers to stay home than they could make by re-entering the workforce. Whatever the cause, the effect is that companies in just about every sector of the economy are struggling to find and keep enough workers to meet current demand – which only exacerbates cost pressures even more.
One of the areas that seems to seeing a strong reaction to these indications of cost inflation is in the Food Products industry – an industry that I usually like to think of as a good way to position a portfolio with moderated, even defensive options to help moderate risk. One specific area that seems to be showing unexpected inflationary conditions is in the cost of goods companies in this industry have been seeing over the last few months, and which many fear could continue into this year. Conagra Brands, Inc. (CAG) is an example. After the company’s latest earnings report, management revised its outlook for 2022, citing cost increases that could extend into the next year. That news prompted investors to start dumping shares and putting pressure on the entire industry. From a peak at around $39 in early June, the stock dropped to a low in August at around $32. From that point, the stock has consolidated into a range between $32 and $34, where the stock peaked earlier this month before dropping back again. With its latest earnings report in the rear-view mirror, the question that naturally arises is whether the drop now puts the stock in the range of a useful value, or whether the cost pressures just described have effected the company’s fundamentals in a negative way? Let’s dive in and find out.
Fundamental and Value Profile
Conagra Brands, Inc., formerly ConAgra Foods, Inc., operates as a packaged food company. The Company operates through two segments: Consumer Foods and Commercial Foods. The Company sells branded and customized food products, as well as commercially branded foods. It also supplies vegetable, spice and grain products to a range of restaurants, foodservice operators and commercial customers. Conagra Foodservice offers products to restaurants, retailers, commercial customers and other foodservice suppliers. The Company also operates in the countries outside the United States, such as Canada and Mexico. The Company’s brands include Marie Callender’s, Healthy Choice, Slim Jim, Hebrew National, Orville Redenbacher’s, Peter Pan, Reddi-wip, PAM, Snack Pack, Banquet, Chef Boyardee, Egg Beaters, Rosarita, Fleischmann’s and Hunt’s. The Company sells its products in grocery, convenience, mass merchandise and club stores. CAG’s current market cap is $16.1 billion.
Earnings and Sales Growth: Over the last twelve months, earnings declined about -28.6%, while Revenues dropped by -1%. Earnings and sales also dropped in the last quarter – by -7.41% and -3.15%, respectively. The company’s margin profile over the last twelve months is healthy, with Net Income at 10.8% of Revenues over the past twelve months and weakening to 8.87% in the last quarter.
Free Cash Flow: CAG’s free cash flow is $811.4 million over the last twelve months. That marks a decline from $964.2 million in the quarter prior, and a little over $1.5 billion two quarters ago. The current number also translates to a modest Free Cash Flow Yield of about 5.09%.
Debt to Equity: CAG has a debt/equity ratio of 1.02. That number has declined from 1.58 at the beginning of 2019, but the number remains a tad high, a reflection of the reality that the company’s liquidity is a significant question mark. In the last quarter Cash and liquid assets were about $67 million – a decline from $438.2 million in the last quarter of 2020, versus about $5 billion in long-term debt. Most of that debt is attributable to CAG’s acquisition of Pinnacle Foods in the last quarter of 2018, and it is true that the company has paid down more than $3 billion of that debt over the course of 2021, which can at least partly explain the steady decline in cash and liquid assets.
Dividend: CAG pays an annual dividend of $1.25 per share – which the company increased from $.85 in its last earnings call of 2020, and $1.10 earlier this year, and which translates to an annual yield of about 3.76% at the stock’s current price. An increasing dividend is a strong sign of management’s confidence in their business model and their operating success in the future.
Price/Book Ratio: there are a lot of ways to measure how much a stock should be worth; but I like to work with a combination of Price/Book and Price/Cash Flow analysis. Together, these measurements provide a long-term, fair value target at about $34.50 per share. That means the stock is very close to its fair value target right now, with just about 4% upside from its current price. It is also worth noting that in the last quarter, this same analysis put the stock’s fair value target at around $45 per share.
Technical Profile
Here’s a look at the stock’s latest technical chart.
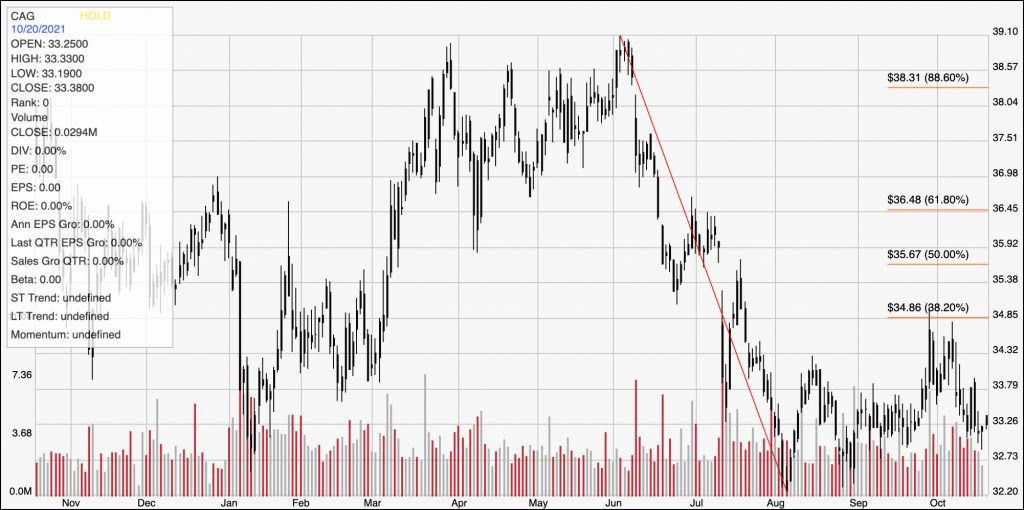
Current Price Action/Trends and Pivots: The chart above marks the stock’s price activity over the last year. The red diagonal line marks the stock’s drop from a peak in August 2020 at around $39.50 to a low in August at around $32. It also provides the baseline for the Fibonacci retracement lines shown on the right side of the chart. The stock established a pretty narrow consolidation range from late August through September between $32.50 and $33.50, and broke out of that range in the last week of September, but has since fallen back to just a little above $32 since then. That puts current support at $32, with immediate resistance sitting a little above $34. The stock would need push to about $35 – a little above the 38.2% retracement line – to mark a useful, trend-reversing shift of bullish momentum, with upside in that case to about $36.50 where the 61.8% retracement line sits. A drop below support at $33 should have limited downside, with the stock’s 52-week low at $32 waiting.
Near-term Keys: From a fundamental standpoint, CAG’s profile has lost quite a bit of the luster it showed earlier this year. The stock’s current bearish momentum has pushed the stock low enough, however that looking for a short-term bearish trade doesn’t really offer a lot of downside, so shorting the stock or buying put options is a very low-probability trade right now. A better set up would come from a push above $35 per share; that could provide a decent signal to think about buying the stock or working with call options using $36.50 to $37 as a near-term profit target.