Over the course of my investing career, I have learned to rely on a lot of fundamental data to paint a picture about the underlying strength of any stock I might consider using for a value-based investment. While some fundamental investors prefer to work with easy-to-reference, quick-glance data like earnings per share and price-to-earnings ratios, I prefer to expand my view of a company’s profitability by also looking at the company’s pattern of Net Income and Free Cash Flow growth.
Earnings per share is a useful, standardized method of describing a company’s profit in a given period on a per-share basis; but it is also a number that can be calculated a number of different ways, which means that there is quite a bit of subjectivity a creative financial manager can inject into a company’s earnings numbers. On the other hand, Net Income (income remaining after expenses) and Free Cash Flow (the cash left after operating expenses and capital expenditures) are generally more straightforward measurements with less malleability, which is why I find them generally more reliable. That doesn’t mean earnings don’t have a place in my process – instead, I like to use all three measurements together. A pattern of growth in all three metrics is the ideal and best-case scenario, while divergences in one or more of these data points relative to the others can signal problems that need to be examined in more detail.
One of the stocks that has become like an old, familiar friend for me over the last couple of years is Bristol-Myers Squibb Company (BMY). This is a stock that I had already followed for about two years and used a few times to nice overall effect in 2020, but that hasn’t drawn a ton of attention from market analysts and talking heads lately as most of the focus since the beginning of 2020 has been on fractious political rhetoric, as well as the ongoing reality that COVID-19 questions continue to loom over just about every discussion, financial, political or otherwise.
The simple fact is that throughout the pandemic, COVID has and continues to push health care facilities and medical professionals to their limits. I think part of that is a reflection of the reality that, besides the pandemic, there is still a need for other, “normal” types of health care as well. I think that is where BMY has an important role to play not only in a society but in a smart investor’s watchlist right now. This is a stock that has experienced some pretty wide swings between high and low points over the last year, with a big drop from an August high at almost $70 to a low in October at around $56.
My read on the stock’s wide trading ranges is that it reflects investor’s attempts to understand the challenges imposed not only by the integration of two large businesses but also by practical difficulties forced on the entire business world – and on the Healthcare sector in general and in particular – in the face of the COVID pandemic. BMY’s Net Income dropped into negative territory because of the challenges of 2020, but even so it still boasts one of the strongest, long-term development pipelines in the Pharmaceutical industry that became even less concentrated and more diversified with the completion of the Celgene acquisition, and dovetailing with what I think will inevitably be an increased level of scrutiny and attention – appropriately so, and in the long run, to our collective benefit – on proper health and care on an individual level. I think the reduction in Net Income is ultimately a temporary concern, primarily because the company’s other strengths, including robust, stable Free Cash Flow and a strong balance sheet provide healthy liquidity to absorb its current negative Net Income. I also think that the stock’s recovery from its October low – it is sitting a little below $59 as of this writing – is a good opportunity to buy a stock at significantly discounted price, and at a useful point in time where the stock’s momentum could be pushing back into bullish territory. Let’s dive in to the numbers.
Fundamental and Value Profile
Bristol-Myers Squibb Company is engaged in the discovery, development, licensing, manufacturing, marketing, distribution and sale of biopharmaceutical products. The Company’s pharmaceutical products include chemically synthesized drugs, or small molecules, and products produced from biological processes called biologics. Small molecule drugs are administered orally in the form of a pill or tablet. Biologics are administered to patients through injections or by infusion. The Company’s products include Empliciti, Opdivo, Sprycel, Yervoy, Eliquis, Orencia, Baraclude, Hepatitis C Franchise, Reyataz Franchise and Sustiva Franchise. It offers products for a range of therapeutic classes, which include virology, including human immunodeficiency virus (HIV) infection; oncology; immunoscience, and cardiovascular. Its products are sold to wholesalers, retail pharmacies, hospitals, government entities and the medical profession across the world. BMY has a current market cap of $130.1 billion.
Earnings and Sales Growth: Over the last twelve months, earnings increased by 22.7%, while sales increased about 10.3%. In the last quarter, earnings improved by 3.63% while sales were flat, but slightly negative at -0.68%. BMY’s Net Income versus Revenue pattern is a red flag that continues to bear watching; over the last twelve months this number was -11.89%, but increased to 13.3% in the last quarter. The turn to positive territory in the last quarter is a continuous of a pattern established two quarters ago, and is something that I take as a positive sign the company is returning to profitability as it continues to navigate the transitory period required to integrate two huge operations into a single company, along with the complications imposed by the global pandemic.
Free Cash Flow: BMY’s Free Cash Flow is healthy, at $14.88 billion. That marks an increase from about $11.9 billion in the last quarter. It also translates to a Free Cash Flow Yield of 11.48%. The strength in this number is a useful counterpoint to the negative Net Income pattern I just described and implies that the company’s ability to service its debt, maintain its dividend and keep its business growing remains intact.
Debt to Equity: BMY has a debt/equity ratio of 1.06 – a high number that is primarily attributed to the debt assumed during the completion of the Celgene deal. As of the last quarter, cash and liquid assets were $15.6 billion versus $39.6 billion in long-term debt. Pre-merger, BMY had just $5.3 billion in debt versus more than $8 billion in cash; however management as well as most analysts predicted the deal would be immediately accretive, even allowing for the temporary, negative impact on Net Income. So far that appears to be the case, which means the high debt level continues to be more than serviceable.
Dividend: BMY pays an annual dividend of $1.96 per share, which at its current price translates to a dividend yield of about 3.34%. Management increased the dividend from $1.80 per share, per annum in mid-2020. The increase is a strong signal of management’s confidence in its business strategy and overall financial strength.
Price/Book Ratio: there are a lot of ways to measure how much a stock should be worth; but I like to work with a combination of Price/Book and Price/Cash Flow analysis. Together, these measurements provide a long-term, fair value target around $82 per share. That suggests that even with its current upward trend, BMY remains nicely undervalued, with 40% upside from its current price.
Technical Profile
Here’s a look at the stock’s latest technical chart.
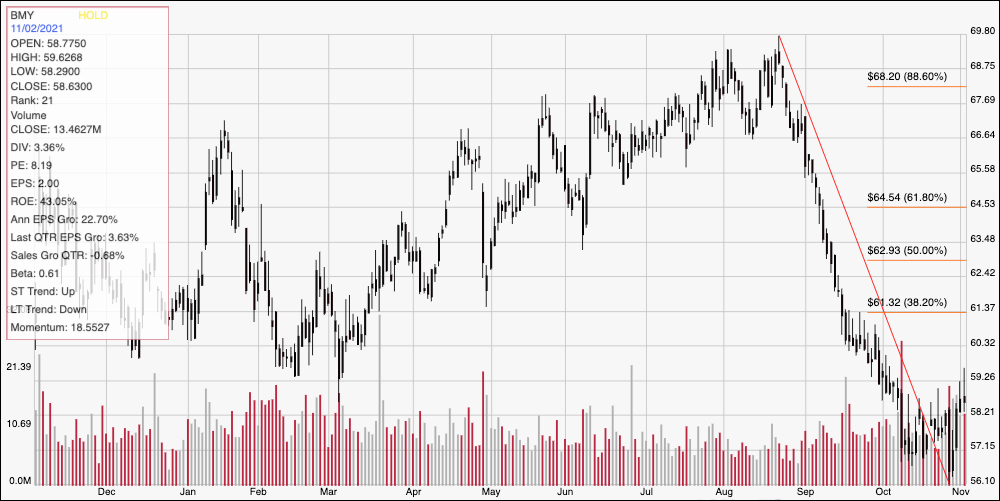
Current Price Action/Trends and Pivots: The chart above displays the last year of price activity for BMY. The red diagonal line traces the stock’s downward plunge from its August high at nearly $70 its low last month at around $56; it also provides the baseline for the Fibonacci retracement lines shown on the right side of the chart. The stock has picked up bullish momentum in the last couple of days, and it approaching immediate resistance at around $59, with current support back at the recent, 52-week low around $56. A push above $59 should see near-term upside to between $61 and $62, while a drop below support only has about $1 of downside to next support at around $55. A drop below $55, however could see the stock fall to between $50 and $51 per share.
Near-term Keys: The red flag in BMY’s fundamental profile is the negative Net Income pattern, however the turn to positive territory in the last two quarters is very positive sign. Their strong pattern of Free Cash Flow also offers a counterpoint that I think underscores their overall fundamental strength, even amid some current difficulties. If you prefer to work with short-term trading strategies, a push above $59 could offer an opportunity to buy the stock or work with call options, with about $3 of upside to $62 as a good bullish profit target. A drop below $55 could be a good signal to think about shorting the stock or buying put options, using $51 50 as useful profit targets on a bearish trade.