No matter whether you prefer to focus on short-term trading strategies that emphasize a stock’s current price momentum or longer-term methods focusing on fundamental strength and a stock’s value-based price, there are a myriad number of issues that come at you and demand attention. Some of those elements can be foreseen to a certain extent; for example, if a company is getting set for a new quarterly earnings report, it’s pretty normal to see a stock’s price become more volatile and to experience wider-than-normal swings from high to low.
Other elements are far less predictable, because they are driven by events and issues that fall outside the scope of normal, expected occurrence. Labor strikes are an example; while they are generally driven by economic and industry factors and issues that are known, they have a way of catching the majority of the investing public and even industry insiders by surprise. Labor strikes decrease production capacity in the short-term, limiting a company’s ability to meet the demand for the products it creates. It can also carry a long-term impact on costs, as labor negotiates for higher pay, improved benefits, and improved working conditions, to name just a few elements often at play that generally require a company to allocate more of its budget towards those issues. More often not, those costs carry forward to the consumer level in the form of higher prices for finished goods.
Kellogg Company (K) is a good example of what I mean. They do a lot more than just cereal, of course, but the truth is that the cereal aisle is where you recognize them the most quickly. U.S. cereal sales, in fact account for approximately 20% of K’s annual sales. During the early stages of 2020, pandemic disruptions and isolation requirements prompted a big push to food storage and eating at home that provided a big boost to K’s entire portfolio and positively impacted the company’s bottom line. More recently, however, the company made news when more than 1,000 of its cereal plant workers went on strike. That prompted the stock to reverse a short-term rally that saw the stock push to a peak a little above $65 to a low in late October at around $61. The conflict has remained unresolved, raising questions not only about how long it will continue but also what the long-term impact of the strike itself, and of its final conclusion (whenever it comes) may be. So far this month, the stock price has remained resilient, although a bit below its October highs. In the interim, the company’s fundamentals are still generally solid, while also showing some signs of weakening. The stock’s value proposition using traditional metrics, in the meantime suggest that the stock could be very undervalued. Altogether, it’s an interesting mix that begs the question: is the bargain argument valid, or is this a cautionary example of a value trap? Let’s dive in and try to find out.
Fundamental and Value Profile
Kellogg Company is a manufacturer and marketer of ready-to-eat cereal and convenience foods. The Company’s principal products are ready-to-eat cereals and convenience foods, such as cookies, crackers, savory snacks, toaster pastries, cereal bars, fruit-flavored snacks, frozen waffles and veggie foods. Its segments include U.S. Morning Foods, which includes cereal, toaster pastries, health and wellness bars, and beverages; U.S. Snacks, which includes cookies, crackers, cereal bars, savory snacks and fruit-flavored snacks; U.S. Specialty, which represents food away from home channels, including food service, convenience, vending, Girl Scouts and food manufacturing; North America Other, which includes the U.S. Frozen, Kashi and Canada operating segments; Europe, which consists of European countries; Latin America, which consists of Central and South America and includes Mexico, and Asia Pacific, which consists of Sub-Saharan Africa, Australia and other Asian and Pacific markets. K’s current market cap is $21.6 billion.
Earnings and Sales Growth: Over the last twelve months, earnings increased a little over 19.75%, while revenues were 5.63% higher. In the last quarter, earnings declined -4.39%, while sales increased a little less than 2%. The company operates with a generally healthy, stable margin profile; over the last twelve months, Net Income during was 8.86% of Revenues, and tapered only somewhat in the last quarter to 8.48%.
Free Cash Flow: K’s free cash flow is $951 million and translates to a Free Cash Flow Yield of 4.41%. That marks the fourth straight quarter of a steady decline from almost $1.5 billion a year ago, and is something that many analysts are pointing as a confirmation of the challenges the company is facing from supply chain issues, and now from the potential for higher costs resulting from the ongoing labor strike.
Debt to Equity: K has a debt/equity ratio of 1.75. This is a high number, and makes them one of the most heavily leveraged stocks in the Food Products industry. Their balance sheet indicates that in the last quarter, cash and liquid assets were a little over $441 million, versus $7 billion in long-term debt. That marks an increase from the last six months, when cash was $391 million.
Dividend: K’s annual divided is $2.32 per share and translates to a yield of about 3.67% at the stock’s current price.
Price/Book Ratio: there are a lot of ways to measure how much a stock should be worth; but I like to work with a combination of Price/Book and Price/Cash Flow analysis. Together, these measurements provide a long-term, fair value target around $83.50 per share, which means that K remains very undervalued, with about 32% upside from its current price. It is worth nothing that earlier this year, this same analysis yielded a fair value target at around $89 per share – which could be one more reflection of the company’s challenges as previously described.
Technical Profile
Here’s a look at the stock’s latest technical chart.
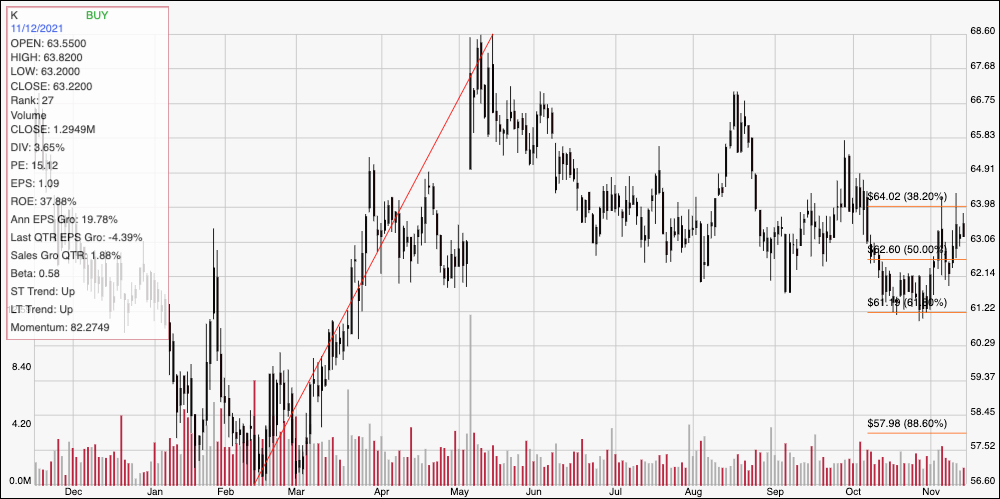
Current Price Action/Trends and Pivots: This chart traces the stock’s movement over the last year. The diagonal red line traces the stock’s upward trend from a February low at around $56.50 to its May high at around $68.50. It also provides the baseline for the Fibonacci retracement lines shown on the right side of the chart. The stock has moved into a gradual downward trend from that May high, and appears to have found a trend bottom at the 61.% retracement line around $61. More recently, the stock’s bullish momentum has pushed the stock above the 50% retracement to just a little below the 38.2% line, marking immediate resistance at around $64, with current support at the last pivot low around $62. A drop below $62 has limited downside, with next expected support at the 61.8% retracement line and around $61; but if bearish momentum pushes the stock below that point, the stock could fall to anywhere between $59 and $58. A push above $64, on the stock hand should see near-term upside to somewhere between $66 and $67.
Near-term Keys: K’s value proposition on this stock appears compelling, but I do think that the drop in my fair value target, along with the decline in free cash flow could be leading indicators of near-term risks associated with the inflationary pressures of ongoing supply chain issues and the uncertainty of labor conflict. I’m not ready to call the stock a value trap, but those are risks that I think should make even a long-term, value-oriented investor cautious. That also means that the best opportunities for now lie in short-term trading strategies. A push above resistance at $64 could provide a good signal to consider buying the stock or working with call options, using next resistance at around $67 as a good exit point. A drop below $61, on the other hand could provide a useful signal to consider shorting the stock or buying put options, using $59 to $58 as a useful profit target on a bearish trade.