Sometimes, answering the question of whether a stock represents a legitimate, attractive value opportunity can be hard to do. A company could be struggling not only to grow its business, but may be forced to restructure its business in a way that makes most of the traditional measurables investors like to use look very unfavorable. Strict, quantitative value and fundamental analysis would dictate that you stick to the numbers, and that you distrust anything but what the numbers tell you. That isn’t always the most sensible thing to do, however simply because business isn’t always just about the numbers.
It isn’t that the numbers – sales, earnings, free cash flow, debt, and so on – aren’t important, because of course they always are. They help to frame a company’s business over any given period of time in a useful context. Sometimes, however, you also need to be able to look beyond the limits of what that context may describe. It can be important to remember that the numbers that make up fundamental and value-based metrics are almost always historical in nature; even forward-looking measurements and estimates tend to rely on past performance to provide a framework for what a company might be able to do in the future. This is really where one of the challenges of stock market and value-based analysis is greatest, because this is really more art than science.
It might sound like I’m talking about trusting your gut, or being willing to compromise on some of the fundamental criteria you usually use to guide your investment decisions, but I don’t really like to do either of those things. As an investor, my gut tends to be wrong more often than it’s right, which is why over the course of my investing career I moved away from even more subjective, low-probability methods like short-term swing, trend or momentum trading. And giving in to the temptation to make allowances for poorer measurables is an emotional response that will make it harder to think objectively about what you should do if the time comes to call a bad investment what it really is. All that said, I do think that there are cases from time to time where a stock’s fundamental strength or value opportunity is hard to quantify by measurables alone.
Signet Jewelers Ltd (SIG) is an interesting example of what I mean. This is a stock that increased from a March 2020, bear market bottom at around $5.50 to a high late last month at around $112 – a performance that includes an increase from about $25 last December to that peak. If you look outside of the last two years however, the stock is still significantly below its 2016, all-time high at around $150 per share. That means that even with the impressive upward trend and massive increase in price since the beginning of 2020, the stock isn’t totally out of the woods. From that 2016 peak and into early 2020, the stock’s decline can primarily be attributed to chronic internal problems, such as pay discrimination and sexual harassment lawsuits that prompted a change in executive leadership in 2017, as well as required adjustments to shifting consumer trends away from traditional mall shopping, even for leisure items like jewelry to more digital settings. The company had been making progress in implementing a comprehensive transformation plan begun by its new CEO in 2017 until COVID-19 came to play.
While SIG undoubtedly saw the same kind of big impact on its business from forced shutdowns of retail locations that practically every brick-and-mortar retailer struggled with, the company’s balance sheet has remained remarkably resilient, with very low, manageable debt and healthy liquidity as well as Free Cash Flow. The stock’s price activity since its last high adds to the intrigue, since the stock has fallen a little over 20% from that point as broad market uncertainty has increased. The stock also looks like it could be finding a useful support point to set up a useful, bullish rebound, making it tempting bait for momentum traders and bullish, growth-oriented investors alike. Has the stock dropped enough off of its recent high to possibly make the stock a useful value candidate as well? Let’s try to find out.
Fundamental and Value Profile
Signet Jewelers Limited is a retailer of diamond jewelry. The Company’s segments include the Sterling Jewelers division; the Zale division, which consists of the Zale Jewelry and Piercing Pagoda segments; the UK Jewelry division, and Other. The Sterling Jewelers division’s stores operate in the United States principally as Kay Jewelers (Kay), Kay Jewelers Outlet, Jared The Galleria Of Jewelry (Jared) and Jared Vault. The Zale division operates jewelry stores (Zale Jewelry) and kiosks (Piercing Pagoda), located primarily in shopping malls across the United States, Canada and Puerto Rico. Zale Jewelry includes the United States store brand, Zales, and the Canadian store brand, Peoples Jewellers. Piercing Pagoda operates through mall-based kiosks. The UK Jewelry division operates stores in the United Kingdom, Republic of Ireland and Channel Islands. The Other segment includes the operations of subsidiaries involved in the purchasing and conversion of rough diamonds to polished stones. SIG’s current market cap is $4.7 billion.
Earnings and Sales Growth: Over the last twelve months, earnings increased nearly 1,200% (not a typo), while sales improved by 18.27%. In the last quarter, earnings declined by nearly -60%, while were -14% lower. The company operates with a traditionally narrow operating profile that had been improving for much of 2021, but has weakened in the last quarter. Over the last twelve month Net Income was 9.86% of sales, but weakened to 6.02% in the last quarter. For broader context, the company saw negative Net Income through most of 2020, but turned it positive in 2021. The recent quarter’s drop could be cyclical, but in the meantime this is an element that bears watching carefully.
Free Cash Flow: SIG’s free cash flow is very attractive, at more than $1.15 billion for the trailing twelve month period; that translates to a Free Cash Flow yield of more than 26% and provides some relief from the company’s mixed margin profile. It also marks an improvement from $967 million at the end of 2020.
Debt to Equity: SIG has a debt/equity ratio of .10, which indicates the company employs a conservative philosophy about leverage and speaks in part to the company’s fortress-level balance sheet. For perspective, consider that in late 2018, SIG held only about $134 million in cash and liquid assets versus $671.1 million in long-term debt. As of the last quarter, cash and liquid assets were a little over $1.5 billion while long-term debt was just $147 million – down from $1.03 billion a year ago. It appears clear that management borrowed heavily at the beginning of 2020 to bolster its balance sheet against the broader declines it anticipated in the wake of the pandemic, as long-term debt jumped from a little over $500 million at the beginning of 2020 to a peak two quarters later at $1.33 billion. Considering that practically all of those obligations are no longer on the books, it’s easy to see why SIG’s balance sheet is a major strength.
Dividend: SIG suspended its dividend in early 2020 to preserve cash, but reinstated in mid-2021 at a rate of $.72 per share on an annualized basis. That is modest, translating to an annualized yield of just 0.81%, but the reinstatement is still a declaration of management’s confidence in the future.
Price/Book Ratio: there are a lot of ways to measure how much a stock should be worth; but I like to worth with a combination of Price/Book and Price/Cash Flow analysis. Together, these measurements provide a long-term target at about $85 per share. That suggests that the stock is somewhat overvalued right now, with about -5% downside to its fair value price, and a practical discount price sitting at around $71 per share.
Technical Profile
Here’s a look at the stock’s latest technical chart.
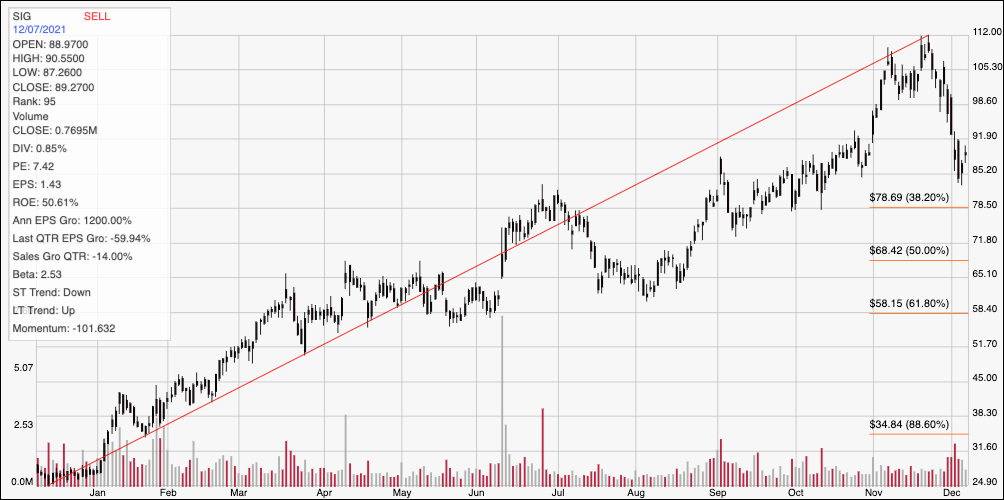
Current Price Action/Trends and Pivots: The chart above traces the stock’s price activity over the last year. The red diagonal line traces the stock’s upward trend from its low at around $25 last December to its peak in November at $112. It also provides the baseline for the Fibonacci retracement lines on the right side of the chart. The stock picked up a lot of bearish momentum after hitting that peak, dropping a little over -20% before finding current support at around $85 per share. Immediate resistance looks to be at around $92 based on previous resistance at that level in October. A push above $92 should have good upside, to about $98 before finding next resistance, while a drop below $85 should find next support at around $78.50 where the 38.2% retracement line waits.
Near-term Keys: The stock’s strong long-term bullish trend pattern makes SIG a tempting stock to consider using for a bullish trade. If the stock can push above $92, there could a good opportunity to buy the stock or work with call options with a bullish target at around $98. A drop below $85 would act as a strong bearish signal to consider shorting the stock or buying put options, with downside to about $78.50. What about the value proposition? The company’s fundamentals are strong enough, with signs that profitability and financial capacity is improving; however, the stock’s long-term trend has pushed the stock above the point of practical value at its current price.