No matter what current market conditions may be at any given time, one of the primary questions any long-term focused investor – whether you prefer a growth or value approach – should be whether the strength of the underlying business is strong enough to justify a stock’s current price. For growth-focused investors, the question is primarily about whether measurements like revenue and earnings are growing, and are expected to continue to grow, enough to justify buying the stock. If they are, even a relatively high current price doesn’t disqualify the stock from being considered. For value-oriented investors, the question is similar, but somewhat contradictory, since the question revolves around determining how to translate a company’s fundamental strengths into a useful price-based reference, against which you can then compare the stock’s current price. The distinction between value and growth in these cases is that the value-based method relies on historical data to measure the worth of the business relative to the stock’s current price, while a growth focus emphasizes forward-looking estimates to guesstimate the stock’s future price.
The value question tends to become more complicated when a stock has followed a long-term upward trend, with indications that it could continue doing so like a generally healthy economy, lower-trending unemployment, and a generally robust consumer environment. Even with pandemic-driven concerns mixed, that has been the environment that we’ve found ourselves in for most of this year, and it is a combination that has helped a lot of large retailers like WalMart Inc. (WMT) and Target Corp (TGT) to not merely survive, but also to thrive for the past year and a half. That is an interesting statement to make right now, because while the “big boys” in the Retailing industry have been feasting, smaller retailers, including regional and local small businesses have struggled to stay in business at all.
WMT is one of the most recognized consumer-driven names in the world, and are generally recognized – along with Amazon – as being the de facto leader in the retail world. Even as AMZN has made its own inroads over the last two decades in the retail space, WMT has kept pace, with the two companies essentially establishing the baseline against which all other companies are measured. That is true no matter whether you’re talking about brick-and-mortar stores, where WMT may be most easily identified, or online retailing; while AMZN has been the clear leader in that space, WMT has moved aggressively to compete, and generally been successful. 2021 has been a profitable year for the company, while the stock has mostly languished since hitting a 52-week high in August at around $152.50; over the last month the stock has begun to consolidate in a range between about $136 and $146, with the stock currently sitting at the low end of that range, and a little over -8% below that yearly high. How does that translate to the stock’s value? Are the fundamentals strong enough to suggest the stock could offer an attractive value, even at such an elevated price? Let’s find out.
Fundamental and Value Profile
Walmart Inc is engaged in the operation of retail, wholesale and other units, as well as eCommerce, located throughout the United States, Africa, Canada, Central America, Chile, China, India and Mexico. The Company offers an assortment of merchandise and services at everyday low prices (EDLP). The Company operates through three segments: Walmart U.S., Walmart International and Sam’s Club. The Walmart U.S. segment includes the Company’s mass merchant concept in the United States. The Walmart International segment consists of the Company’s operations outside of the United States. The Sam’s Club segment includes the warehouse membership clubs in the United States. The Company operates approximately 10,500 stores, clubs and eCommerce Websites under 48 banners in 24 countries. WMT’s current market cap is $385.8 billion.
Earnings and Sales Growth: Over the last twelve months, earnings and sales have increased, with earnings increasing about 8.21%, and sales growing about 4.32%. In the last quarter, earnings declined by -18.54% while revenues were flat, but slightly negative at -0.37%. Like most stocks in this sector, the company operates with an extremely narrow margin profile that has nonetheless improved in the last few months. As a percentage of Revenues, Net Income was 1.40% in the last year, and increased to 2.21% in the last quarter.
Free Cash Flow: WMT’s free cash flow is healthy, at about $17.5 billion. That does mark a decline over the past year, about $26 billion and $18.1 billion in the lat quarter. The current number translates to a Free Cash Flow Yield of 4.48%.
Debt to Equity: WMT has a debt/equity ratio of .45. This is a conservative number that generally suggest the company’s operating profits are sufficient to service the debt they have. They also have good liquidity, with $16.1 billion in cash and liquid assets and $36.4 billion in long-term debt.
Dividend: WMT pays an annual dividend of $2.20 per share, which translates to an annual yield that of about 1.57% at the stock’s current price.
Price/Book Ratio: there are a lot of ways to measure how much a stock should be worth; but I like to work with a combination of Price/Book and Price/Cash Flow analysis. Together, these measurements provide a long-term, fair value target around $104 per share. That means the stock is clearly overvalued, with -26% downside from its current price, and a practical discount price at around $83.
Technical Profile
Here’s a look at the stock’s latest technical chart.
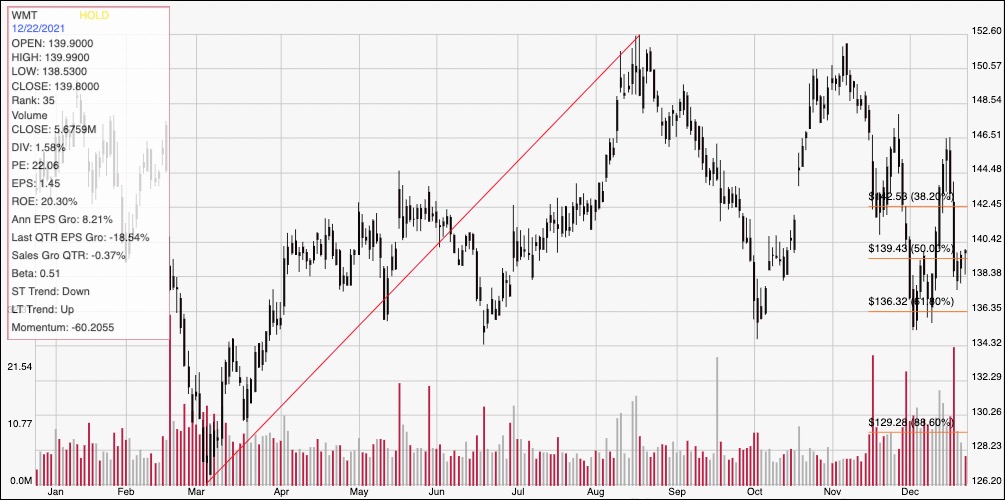
Current Price Action/Trends and Pivots: The chart above displays WMT’s price action over the last year. The red diagonal line plots the stock’s upward trend from a March low at around $126 to its peak earlier in August at around $152.50. It also provides the baseline for the Fibonacci retracement lines shown on the right side of the chart. The stock has mostly hovered from that point, with the stock’s range between support and resistance narrowing in the last month between $146.50 and $136. This week the stock has been moving higher off of current support at around $138, with immediate resistance at around $142. A drop below $138 should find next support at around $136, while a push above $142 could rally to about $146.50.
Near-term Keys: Without a compelling value proposition right now, the most interesting opportunities to work with WMT lie in the potential short-term trading opportunities it could offer. The stock’s current momentum suggests there could be a good opportunity to buy the stock or work with call options, with a useful target price at around $142, or $146 if bullish momentum accelerates. A drop below $138 should have limited downside, but could still offer a workable bearish trade by either shorting the stock or buying put options, with $136 offering a practical, near-term target price and additional downside to about $134 if bearish activity picks up.