For investors, the holiday season generally marks a time when consumer activity should be healthy and demand for consumer goods will be high. That’s a big reason that the latter part of the year, as the colder months set in across the country that retail stocks often start to see healthy increases in prices. That is a broad generalization that is also subject to the variability of economic health from one year to the next, which can of course be heavily influenced by global, macroeconomic considerations, political influences and any number of other factors.
2020, of course was a strange year owing to COVID-19 and the pressures that came with dealing with global restrictions on social and business activities of just about every kind. Most of us hoped, if not expected, 2021 to be a year when we could start looking past the health crisis and talk about getting back to “normal” activities and behaviors, and for a while it looked like that might be happening. Starting this summer, however new variants of the disease have wound their way across the globe, keeping infections rates and hospitalizations high and so keeping COVID and almost all of its associated uncertainty front and center in social and economic conversations.
The ripple effect of these variants – delta and now omicron, in particular – into the markets can interestingly be seen pretty clearly in the movement of some of the biggest, national retailers in the United States. For both (WMT) and Target Corp (TGT), for example, these companies enjoyed significant increases in their stock prices from the first quarter of the year into the summer months. A reasonable correlation can be drawn between the availability and distribution of COVID vaccines in the early part of the year to those price increases, as investors seemed to be betting that vaccines meant the end of the pandemic was in sight and so regular economic activity would be returning to normal.
As infections from the delta variant increased along with hospitalizations moving into the summer months, however, both stocks dropped off of those highs. Moving into October, TGT started rallying into the middle of November, revisiting its high at around $269 before Thanksgiving until broad market fear – now associated with the fast-spreading omicron variant – started putting pressure on the market again. The stock is now below the support level it used in October, but could be starting to stabilize about -18% below that $269 peak.
TGT is an interesting company that has managed to forge its own solid spot as a major national player in the retail industry even as competition in the space has greatly intensified. This is a company that, like WMT experienced healthy improvements in its bottom line in 2020 as they successfully navigated the health crisis, in part by being one of a small handful of “big box retailers” still standing after years of consolidation, and also by expanding the availability and use of the increasingly important omnichannel marketing and commerce strategies that put a big emphasis on online capability. With the stock down quite a bit from its high, of course the question becomes whether those fundamentals are strong enough to translate to a useful value price for one of the most recognizable U.S. retailing names? Let’s try to find out.
Fundamental and Value Profile
Target Corporation (Target) is a general merchandise retailer selling products through its stores and digital channels. Its general merchandise stores offer an edited food assortment, including perishables, dry grocery, dairy and frozen items. Its digital channels include a range of general merchandise, including a range of items found in its stores, along with an assortment, such as additional sizes and colors sold only online. Its owned brands include Archer Farms, Market Pantry, Sutton & Dodge, Art Class, Merona, Threshold, Ava & Viv, Pillowfort, Room Essentials, Wine Cube, Cat & Jack, Simply Balanced and Wondershop. Its exclusive brands include C9 by Champion, Hand Made Modern, Mossimo, DENIZEN from Levi’s, Nate Berkus for Target, Fieldcrest, Kid Made Modern, Genuine Kids from OshKosh and Liz Lange for Target. As of January 28, 2017, the Company had 1,802 stores across the United States, including 1,535 owned stores, 107 leased stores and 160 owned buildings on leased land. TGT’s current market cap is $105.9 billion.
Earnings and Sales Growth: Over the last twelve months, earnings and sales have both increased, with earnings increasing about 8.6%, and sales growing 13.34%. In the last quarter, earnings declined by -16.76% while revenues increased almost 2%. Like most stocks in this sector, the company operates with a narrow margin profile that does show some weakness in the last few months. As a percentage of Revenues, Net Income was 6.56% in the last year, and decreased to 5.8% in the last quarter.
Free Cash Flow: TGT’s free cash flow is healthy, at more than $5.9 billion. A year ago, this number was about $7.9 billion, which along with the decrease in Net Income and declining liquidity (see below), I take as a red flag that needs correcting to make the stock’s fundamentals more appealing. The current number translates to a Free Cash Flow Yield of 5.66%.
Debt to Equity: TGT has a debt/equity ratio of .84. This is a conservative number that generally suggest the company’s operating profits are sufficient to service the debt they have. They also have sufficient liquidity, with $5.9 billion in cash and liquid assets against about $11.6 billion in long-term debt. Cash has declined from nearly $8 billion two quarters ago and $7.3 billion in the previous quarter.
Dividend: TGT pays an annual dividend of $3.60 per share, which translates to an annual yield that of about 1.63% at the stock’s current price.
Price/Book Ratio: there are a lot of ways to measure how much a stock should be worth; but I like to work with a combination of Price/Book and Price/Cash Flow analysis. Together, these measurements provide a long-term, fair value target around $145 per share. That means the stock is clearly overvalued, with -34% downside from its current price, and a practical discount price at around $116.50.
Technical Profile
Here’s a look at the stock’s latest technical chart.
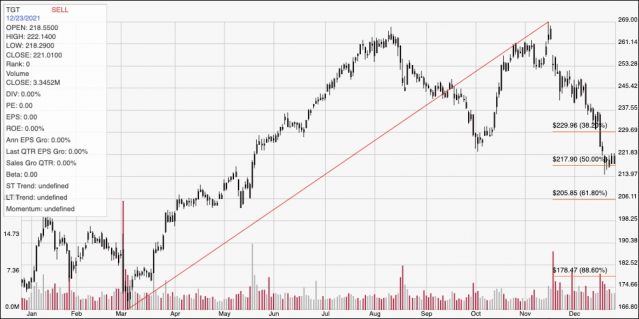
Current Price Action/Trends and Pivots: The chart above displays TGT’s price action over the last year. The red diagonal line plots the stock’s upward trend from its March 2021 low at around $167 to its peak in November at around $269. It also provides the baseline for the Fibonacci retracement lines shown on the right side of the chart. From its high, the stock has decline by about -18%, but appears to have found new, current support this week at around $218, incline with the 50% retracement line. Immediate resistance is at about $222 based ona pivot low at the end of September that provided the push for the stock’s October rally. A push above $222 should give the stock upside to about $230 where the 38.2% retracement rests, while a drop below support at $218 could have about $4 of downside before finding next support around $214.
Near-term Keys: Without a compelling value proposition right now (the stock’s realistic bargain value price is about $105 below the stock’s current price), the most interesting opportunities to work with TGT lie in the potential short-term trading opportunities it could offer. If the stock breaks above immediate resistance at $222, it could offer a useful signal to buy the stock or use call options using $230 as an interesting exit target. A drop below $218 could be a good signal to short the stock or buy put options, using $214 as a practical bearish profit target.