Within the scope of long-term investing, there are two primary methods most investors use: investing for growth, or looking for value. I write a lot in this space about value-oriented investing, because more than two decades of study and hard experience have taught me that it is the investing method that suits me best. It also tends to steer me away from stocks that are at or near yearly or all-time highs. That’s because stocks that offer attractive value are usually trading at the lower end of its historical ranges – which helps to explain why most value-focused investors also tend to think in more than slightly contrarian terms about the market and the nature of trends.
Looking for stocks at the low end of their historical ranges generally increases the odds that the stock will represent a good bargain. That is especially true if the company’s fundamental profile is strong. Sometimes, an unexpected convergence between growth and value investing happens, where a stock that has been following an extended upward trend still offers a useful value. It’s pretty rare, but it does happen often enough that I’ve learned not to simply dismiss a stock due to its current price level without taking a deeper dive into what their book of business actually tells me about their value proposition.
The opposite logic to what I just described is also true. Value seekers tend to be naturally drawn to stocks that have been following extended downward trends because these are the kinds of situations that are most likely to translate to useful value; but the caveat is that the underlying fundamental strength of the company’s business has to be strong enough to suggest that the stock’s current price represents a discount. It isn’t enough simply to see a stock in a downward trend and so to assume that the value is there – and sometimes, even if a stock’s price is on the low end of its historical range and the fundamentals are good, it still won’t translate to a productive value-based opportunity. I’ve learned on my own that sometimes you have be willing to wait for a stock to drop enough to line up with its valuation metrics correctly.
Buckle Inc. (BKE) may be just the kind of stock right now that I’m talking about. The stock followed a long-term upward trend since recovering from its own pandemic-induced low point to a November peak at around $57. After the Thanksgiving break, however, the stock picked up on broad, bearish market momentum and dropped quickly to about $47.50 by the start of December. A little before Christmas the stock gapped down overnight and touched major support at around $39.50. From that point the stock has stabilized and could be building a new set of bullish momentum. This is a company with a very solid balance sheet and a variety of useful fundamental metrics that demonstrate strength and a dividend payout that offers an attractive opportunity for passive income; but does the stock’s current price also represent a useful value? Let’s find out.
Fundamental and Value Profile
The Buckle, Inc. is a retailer of casual apparel, footwear and accessories for young men and women. The Company operates approximately 446 retail stores in 42 states throughout the United States under the names Buckle and The Buckle. The Company markets a selection of brand name casual apparel, including denims, other casual bottoms, tops, sportswear, outerwear, accessories and footwear. The Company provides customer services, such as free hemming, free gift-wrapping, easy layaways, the Buckle private label credit card, and a guest loyalty program. Its offers denims from brands, such as Miss Me, Rock Revival, KanCan, Bridge by GLY, Flying Monkey, Levi’s, and Wrangler. Other brands include Hurley, Billabong, Affliction, American Fighter, Howitzer, Oakley, Fox, Obey, RVCA, Salvage, 7 Diamonds, Nixon, Free People, White Crow, Salt Life, Corral, Reef, Kustom, Timberland, SOREL, Hey Dude, Steve Madden, SAXX, Stance, Ray-Ban, Wanakome, Champion, Fossil, and G-Shock. BKE’s current market cap is $2.1 billion.
Earnings and Sales Growth: Over the last twelve months, earnings increased almost 48.24% while revenue grew by 27.26%. In the last quarter, earnings grew by 21.15%, while revenues were 8.24% higher. The stock’s operating profile over the last twelve months is very healthy, with Net Income at 19.19% of Revenues, and increasing slightly to 19.48% in the last quarter.
Free Cash Flow: BKE’s free cash flow is very healthy, at $306.98 million. This number translates to a healthy Free Cash Flow Yield of 14.81% and marks a big increase from the end of 2020 at $219.87 – although it has remained below its mark from two quarter ago, at $339.15 million.
Debt to Equity: BKE has a debt/equity ratio of 0, which is indicative of the fact the company operates with no debt. Their balance sheet also shows a little over $480 million in cash and liquid assets – an increase from $415.31 million in the quarter prior.
Dividend: BKE pays an annual dividend of $1.40 per share, which translates to a yield of 3.36% at the stock’s current price. Management increased the dividend from $1.32 per share after the latest earnings announcement, which is a solid confirmation of their confidence in the company’s prospects moving forward.
Price/Book Ratio: there are a lot of ways to measure how much a stock should be worth; but I like to work with a combination of Price/Book and Price/Cash Flow analysis. Together, these measurements provide a long-term, fair value target around $29.30 per share. That means that despite the fundamental strengths I just described, BKE is overvalued, with -30% downside from its current price, and a useful discount price at around $23.50 per share. It is also worth noting that in the prior quarter, this same analysis yielded a “fair value” target price at $31.50 per share.
Technical Profile
Here’s a look at the stock’s latest technical chart.
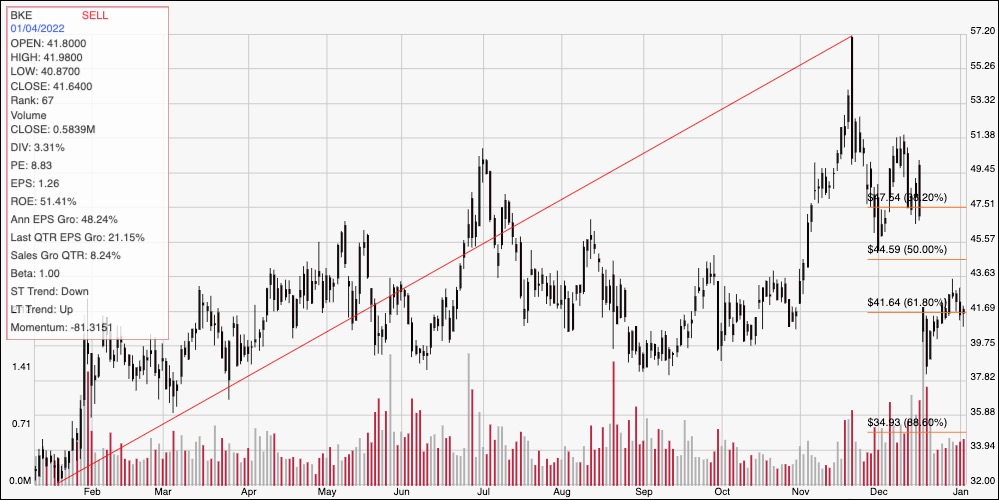
Current Price Action/Trends and Pivots: The chart above displays BKE’s price action over the past year. The diagonal red line traces the stock’s upward trend from a low point at around $32 to its November high at around $57 per share; it also provides the reference for calculating the Fibonacci retracement levels indicated by the horizontal red lines on the right side of the chart. The stock’s bearish momentum from that high pushed the stock below the 61.8% retracement line, but it has begun to stabilize around that level since, putting current support at around $39.75 and immediate resistance at about $43 per share. A push above $43 should have room to rally to about $45.50 based on a pivot low point at the beginning of December. A drop below $39.75 could see the stock fall to about $36 based on pivot activity in February and March of 2021, with additional downside to $35 if bearish momentum accelerates.
Near-term Keys: While BKE’s pullback since Thanksgiving is interesting, it isn’t enough, unfortunately to also make the stock a useful value. The company’s underlying fundamental strength is an excellent reason, however to keep this stock in your watchlist. For now, the best probabilities for working with this stock come from short-term trading strategies; a push above $43 could offer an interesting signal to buy the stock or work with call options, using a short-term target at $45.50 as a useful price area to take profits. A drop below $39.75, on the other hand could be a good signal to consider shorting the stock or buying put options, with $36 to $35 acting as a useful near-term profit target on a bearish trade.