One of the themes that has become more and more prevalent over the past year in the stock market is the pace of inflation. Inflation is one of those words that tends to stoke fear in the marketplace, because it is usually tied so closely with central bank monetary policy. it is also something that generally got pushed into the background in 2020, as government-mandated shutdowns in response to the COVID-19 pandemic brought economic activity in the first part of the year. The extreme response to the early stages of the crisis meant that through the latter part of 2020 and into 2021, most economists and investors still paid attention to inflation, but now as a necessary indicator that economic activity was starting to resemble some sense of normalcy.
The reality of inflation is that it is an ever-present dynamic with which any and all economies have to contend. The real concern, like any market-based economy is tied to the ebb and flow of inflationary pressures. Lack of inflation implies that costs are being driven down, which sounds good at first blush, but which in an extended, extreme state points to declines in demand that usually signal bigger problems such as those we all had to deal with in early 2020. Flip the coin, and increasing inflation does suggest that costs are increasing, which is a concern, but also to rising demand from businesses and consumers that we all generally take as indicative of a healthy, growing economy. The concern is that when inflation has been extended to extreme highs, there are larger issues that prevent suppliers from effectively meeting demand.
Questions about the pace of inflation really started to pick up in 2021, as residual impacts of the health crisis began to be seen on a broader basis. Capital investments that manufacturers and producers of capital goods were required to make to adjust to CDC-recommended distancing and safety protocols just to stay in operation, for example, are just one example of elements that started to push the cost of basic goods higher last year. Even as economic activity has picked up, and employment numbers have improved, labor shortages have yet to be fully resolved on a number of levels for companies at various stages along the supply chain, which adds even more pricing pressure. Factor in the reality that the health crisis isn’t abating, but is likely to continue through much of 2022, and you start to get a sense of the kind of “perfect storm” dynamics that often mark extreme inflationary conditions.
One of the areas that seems to seeing a strong reaction to these indications of cost inflation is in the Food Products industry – an industry that I usually like to think of as a good way to position a portfolio with moderated, even defensive options to help moderate risk. One specific area that seems to be showing unexpected inflationary conditions is in the cost of goods companies in this industry have been seeing for most of the last year and seem likely to continue in 2022. Conagra Brands, Inc. (CAG) is an example. Management has cited cost increases to explain pressures on its business that have hampered liquidity and increased long-term debt, and which they also used to decrease their own estimates for the company’s financial performance in 2022. That news prompted investors to start dumping shares. From a peak at around $39 in early June 2021, the stock dropped to a low in December at around $30.50. The stock picked up bullish momentum from that point, driving to a recent peak near $35 at the start of January. Does that mean the company is ready to turn the corner, and more importantly, does the stock’s overall decline suggest that it could be a good value candidate now? Let’s dive in and find out.
Fundamental and Value Profile
Conagra Brands, Inc., formerly ConAgra Foods, Inc., operates as a packaged food company. The Company operates through two segments: Consumer Foods and Commercial Foods. The Company sells branded and customized food products, as well as commercially branded foods. It also supplies vegetable, spice and grain products to a range of restaurants, foodservice operators and commercial customers. Conagra Foodservice offers products to restaurants, retailers, commercial customers and other foodservice suppliers. The Company also operates in the countries outside the United States, such as Canada and Mexico. The Company’s brands include Marie Callender’s, Healthy Choice, Slim Jim, Hebrew National, Orville Redenbacher’s, Peter Pan, Reddi-wip, PAM, Snack Pack, Banquet, Chef Boyardee, Egg Beaters, Rosarita, Fleischmann’s and Hunt’s. The Company sells its products in grocery, convenience, mass merchandise and club stores. CAG’s current market cap is $16.5 billion.
Earnings and Sales Growth: Over the last twelve months, earnings declined about -21%, while Revenues improved by 2.13%. Earnings and sales both increased in the last quarter – by 28% and 15.29%, respectively. The company’s margin profile over the last twelve months is generally healthy, but showing some signs of deterioration. Income was 9.82% of Revenues over the past twelve months and decreased to 9.01% in the last quarter. The most recent quarter is an extension of the same pattern demonstrated in the quarter prior, when that three-month period showed Net Income at 10.8% of Revenues over the prior twelve months and weakened to 8.87%.
Free Cash Flow: CAG’s free cash flow is $718.3 million over the last twelve months. That marks a decline from $811.4 million in the quarter prior, and a little over $1.5 billion a year ago. The current number also translates to a modest Free Cash Flow Yield of about 4.39%.
Debt to Equity: CAG has a debt/equity ratio of .97. That number has declined from 1.58 at the beginning of 2019, but the number remains a tad high, a reflection of the reality that the company’s liquidity is a significant question mark. In the last quarter Cash and liquid assets were about $69 million – a decline from $438.2 million in the last quarter of 2020, versus about $8.5 billion in long-term debt. Most of that debt is attributable to CAG’s acquisition of Pinnacle Foods in the last quarter of 2018, and it is true that the company has paid down more than $3 billion of that debt over the course of the last two years, which can at least partly explain the steady decline in cash and liquid assets.
Dividend: CAG pays an annual dividend of $1.25 per share – which the company increased from $.85 in its last earnings call of 2020, and $1.10 in 2021, and which translates to an annual yield of about 3.64% at the stock’s current price. An increasing dividend is a strong sign of management’s confidence in their business model and their operating success in the future.
Price/Book Ratio: there are a lot of ways to measure how much a stock should be worth; but I like to work with a combination of Price/Book and Price/Cash Flow analysis. Together, these measurements provide a long-term, fair value target at about $31 per share. That means the stock is overvalued, with just about -10% downside from its current price. It is also worth noting that in the last quarter, this same analysis put the stock’s fair value target at around $34.50 per share, and $45 during the first half of 2021.
Technical Profile
Here’s a look at the stock’s latest technical chart.
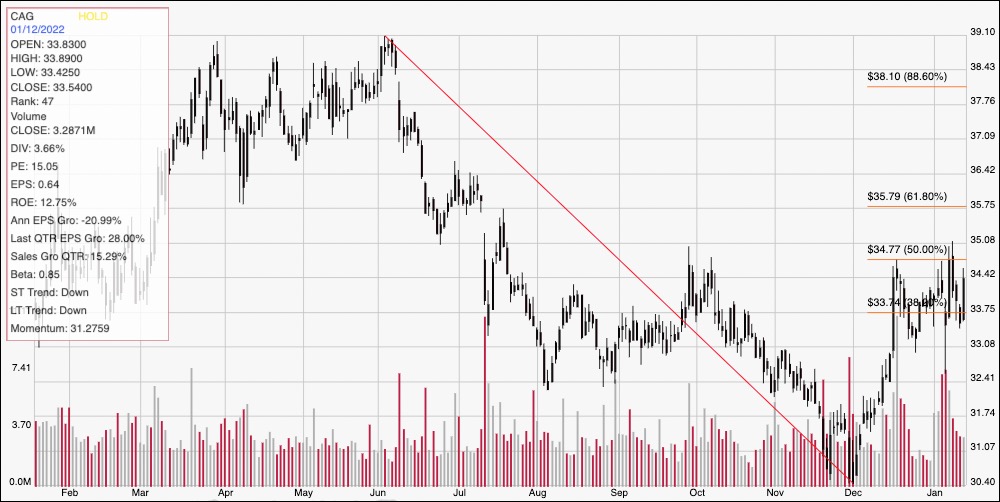
Current Price Action/Trends and Pivots: The chart above marks the stock’s price activity over the last year. The red diagonal line marks the stock’s drop from a peak in June 2021 at around $39 to a low in December at around $30.50. It also provides the baseline for the Fibonacci retracement lines shown on the right side of the chart. From its low, the stock picked up momentum quickly, pushing to about $35 in mid-December, and again at the stock of this year to mark immediate resistance right around the 50% retracement line. Current support is around $33.50 based on pivot low activity seen in December and January, and around the 38.2% retracement line. A push above $35 should have short-term upside to about $36.50, a little above the 61.8% retracement line. A drop below $33.50 should find next support at around $32, but could test the stock’s yearly low at around $30.50 if bearish momentum accelerates.
Near-term Keys: From a fundamental standpoint, CAG’s profile has lost quite a bit of the luster it showed a year ago. While the stock’s latest bullish momentum looks intriguing, its fundamentals don’t support the argument for a higher price. That puts the best probabilities with this stock in short-term trading strategies. You could use a push above $35 as a signal to consider buying the stock or working with call options, with an eye on $36.50 as a good quick-hit profit target. A drop below $33.50 could be a useful signal to consider shorting the stock or buying put options, with $32 providing a reasonable bearish profit target and $30.50 possible if selling activity picks up again.