No matter whether you prefer to focus on short-term trading strategies that emphasize a stock’s current price momentum or longer-term methods focusing on fundamental strength and a stock’s value-based price, there are a myriad number of issues that come at you and demand attention. Some of those elements can be foreseen to a certain extent; for example, if a company is getting set for a new quarterly earnings report, it’s pretty normal to see a stock’s price become more volatile and to experience wider-than-normal swings from high to low.
Other elements are far less predictable, because they are driven by events and issues that fall outside the scope of normal, expected occurrence. Labor strikes are an example; while they are generally driven by economic and industry factors and issues that are known, they have a way of catching the majority of the investing public and even industry insiders by surprise. Labor strikes decrease production capacity in the short-term, limiting a company’s ability to meet the demand for the products it creates. It can also carry a long-term impact on costs, as labor negotiates for higher pay, improved benefits, and improved working conditions, to name just a few elements often at play that generally require a company to allocate more of its budget towards those issues. More often not, those costs carry forward to the consumer level in the form of higher prices for finished goods, or they may force management to defer capital expenses and investments in other important areas of the business.
Kellogg Company (K) is a good example of what I mean. They do a lot more than just cereal, of course, but the truth is that the cereal aisle is where you recognize them the most quickly. U.S. cereal sales, in fact account for approximately 20% of K’s annual sales. During the early stages of 2020, pandemic disruptions and isolation requirements prompted a big push to food storage and eating at home that provided a big boost to K’s entire portfolio and positively impacted the company’s bottom line. More recently, however, the company made news when more than 1,000 of its cereal plant workers went on strike. That prompted the stock to reverse a short-term rally that saw the stock push to a peak a little above $65 to a low in late October 2021 at around $61. The stock’s price has been fairly resilient since then, even driving to a high at around $68 in mid-January; but the fact is that the long-term result of those labor issues, along with increasing materials costs have prompted management to cut investments in marketing and promotions at a time when their primary competitors seem to be doing the opposite. Will that mean K could cede market share to its more aggressive competitors, or will the company be able to depend on brand recognition and loyalty to keep driving revenue? Some analysts are expecting the eating-at-home trend that has punctuated the pandemic to moderate, but with inflation increasing, and questions about the pace and scope of interest rate increases unanswered, I’m less convinced. In the meantime, K’s fundamentals are still generally solid, with signs of improvement in what I consider to be some of the most critical fundamental metrics. The stock’s value proposition, in the meantime suggests that the stock could be very undervalued. Altogether, it’s an interesting mix that begs the question: is the bargain argument valid, or is this a cautionary example of a value trap? Let’s dive in and try to find out.
Fundamental and Value Profile
Kellogg Company is a manufacturer and marketer of ready-to-eat cereal and convenience foods. The Company’s principal products are snacks, such as crackers, savory snacks, toaster pastries, cereal bars, granola bars and bites; and convenience foods, such as, ready-to-eat cereals, frozen waffles, veggie foods and noodles. Its segments include North America, which includes the United States businesses and Canada; Europe, which consists principally of European countries; Latin America, which consists of Central and South America and includes Mexico; and Asia Middle East Africa (AMEA), which consists of Africa, Middle East, Australia and other Asian and Pacific markets. The Company’s snacks brands are marketed under brands such as Kellogg’s, Cheez-It, Pringles, Austin, Parati, and RXBAR. Its cereals and cereal bars are generally marketed under the Kellogg’s name, with some under the Kashi and Bear Naked brands. Its frozen foods are marketed under the Eggo and Morningstar Farms brands. K’s current market cap is $22.2 billion.
Earnings and Sales Growth: Over the last twelve months, earnings declined almost -3.5%, while revenues were -1.24% lower. In the last quarter, earnings were almost -24% lower, while sales decreased -5.55%. Despite the negative earnings pattern, the company operates with a healthy margin profile; over the last twelve months, Net Income during was 10.49% of Revenues, and strengthened in the last quarter to 12.66%.
Free Cash Flow: K’s free cash flow is $1.14 billion and translates to a Free Cash Flow Yield of 5.47%. That marks an increase from the last quarter, when Free Cash Flow was $951 million, but is still somewhat below the $1.26 mark of a year ago. The year-over-year decline is something that many analysts point to as a confirmation of the challenges the company is facing from supply chain issues, and now from the potential for higher costs resulting from labor concerns, but I take the quarterly turn, along with improvement in Net Income, as a net positive sign.
Debt to Equity: K has a debt/equity ratio of 1.49. This is a high number, and makes them one of the most heavily leveraged stocks in the Food Products industry. Their balance sheet indicates that in the last quarter, cash and liquid assets were a little over $286 million, versus $6.2 billion in long-term debt. The quarterly cash number marks a decrease from the last quarter, when cash was $440 million, but it should also be noted that the company paid down about $800 million in debt since the end of the third quarter of 2021.
Dividend: K’s annual divided is $2.32 per share and translates to a yield of about 3.58% at the stock’s current price.
Price/Book Ratio: there are a lot of ways to measure how much a stock should be worth; but I like to work with a combination of Price/Book and Price/Cash Flow analysis. Together, these measurements provide a long-term, fair value target around $85.50 per share, which means that K remains very undervalued, with about 32% upside from its current price.
Technical Profile
Here’s a look at the stock’s latest technical chart.
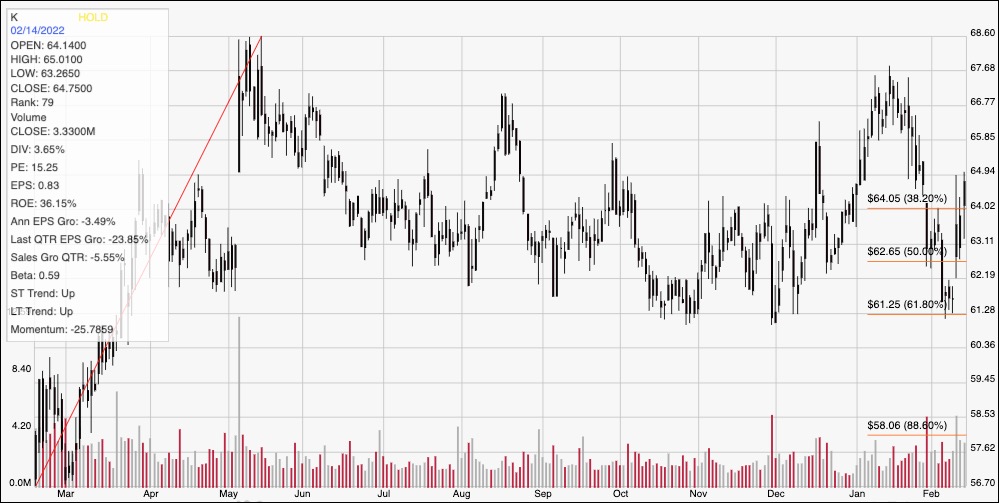
Current Price Action/Trends and Pivots: This chart traces the stock’s movement over the last year. The diagonal red line traces the stock’s upward trend from a February low at around $56.50 to its May high at around $68.50. It also provides the baseline for the Fibonacci retracement lines shown on the right side of the chart. After peaking in mid-January at around $67.50, the stock dropped back to find support at around $61.25, inline with the 61.8% retracement line and has picked up momentum again from that point. The stock pushed above the 38.2% retracement line yesterday, marking current support at around $64, with immediate resistance expected at around $66. A drop below $64 should find next support between $63 and $62 based on consolidation activity seen in November and December of last year, while a push above $66 should find next resistance near the last peak at around $67.50.
Near-term Keys: K’s value proposition on this stock appears compelling, and the company’s improvement in Net Income and Free Cash Flow are strong indications that their overall profitability is solid, even in the face of current conditions. That doesn’t mean that risks associated with rising materials and labor costs are behind the company, but the improvement suggests they have the ability to deal with those concerns as they come. If you prefer to focus on short-term trading strategies, a push above resistance at $66 could provide a good signal to consider buying the stock or working with call options, using next resistance at around $67.50 as a practical, quick-hit exit point. A drop below $64, on the other hand could provide a useful signal to consider shorting the stock or buying put options, using $62 as a timely profit target on a bearish trade.