With tens of thousands of publicly listed stocks available in the U.S. alone, it’s easy to get overwhelmed by the sheer number of stocks that you could consider as a useful investing opportunity at any given time. How can you begin to sort through all of the choices, and all of the noise of market media, talking heads, and diverse analyst opinions to find something that might actually work for you?
That question is one of the things that we all have to grapple with, and it’s been one of the primary reasons that my own investing system has evolved to what it is today. I like to call myself a value investor, but even that broad categorization isn’t enough to really narrow down all of the possible stocks that may be sitting at or near historical lows at any given time. That’s true no matter what the broad market’s current direction is, and it only gets more complicated when conditions become more uncertain, as they have since the beginning of 2022.
One of the things that my study of proper valuation analysis helped me understand was the importance of using fundamental analysis to help guide my evaluation of whether a company’s stock price might actually represent a useful value. Looking at a lot of different fundamental data points helped begin to think in practical terms about ways that fundamental strength can help me begin to winnow the massive number of investing candidates from tens of thousands to a much more manageable quickly. One of the data points that quickly emerged as a primary filtering tool is dividends, because while there are still thousands of stocks that pay a dividend, the truth is that they are a fraction of the total number of publicly listed companies.
Dividends become a good starting point because in order to pay dividends, management has have the dividend payout approved by shareholders. That approval generally only happens if both management and shareholders have confidence in the company’s ability to maintain the dividend over time, which requires not merely stability in the underlying business, but also reasonable prospects for long-term growth to keep driving profitability. When other fundamental metrics like growth in Net Income and Free Cash Flow also fall into place, it becomes easier to start to see where a stock could begin to offer a good value-based opportunity. If those fundamental elements are in place while the stock’s momentum has also generally kept the stock price low, then you have an interesting marriage of convenience and opportunity for a patient bargain hunter.
Looking for value in stocks that have been struggling often means looking for sectors and industries that most other investors have been overlooking. One of the interesting stories of the last two years is the way that the Consumer Discretionary sector has shown its resilience in the face of the pandemic, driven by a massive shift to e-commerce services and solutions. Among the shifts that worked in the favor of a lot of different industries in the sector, including stocks in the Textiles, Apparel & Luxury Goods industry has been an increased focus on personal health and wellness. That is an industry that includes well-known players like Under Armour (UA), Nike (NKE), and today’s highlight, Hanesbrands Inc. (HBI). HBI has easy name recognition, and they also offer an interesting dividend yield at the stock’s current price. The flip side, however is that the stock has also been following a long-term downward trend that has the stock plumbing new 52-week low over the last few weeks, while a number of other companies in the industry are more reflective of the resilience I just described.
For some of these players, I think that resilience can be attributed, at least in part to a trend that has an increasing number of retailers shifting the products they offer, increasing shelf and floor space in favor of brands offered only in their own stores – what is generally being called “private labeling.” It’s a trend that is expected to continue to grow, since private labels offer higher margins in the always-competitive retailing industry where margins are consistently thin and becoming even narrower. That trend has also prompted traditional brands like NKE, UA and more to actively develop their own direct-to-consumer systems to bypass the traditional, more costly retail arrangement. HBI, however has shown little interest in changing their business model to either adapt to the private label trend or to try to combat it; instead they seem to be leaning on the expectation of brand loyalty to see them through. This is a company with some notable fundamental strengths, like improving profitability, healthy Free Cash Flow, and generally manageable debt; but are they enough, with the attractive dividend to also make the stock worth serious consideration as a value-focused, long-term investment? Let’s dive in.
Fundamental and Value Profile
Hanesbrands Inc. is a marketer of everyday basic innerwear and activewear apparel in the Americas, Europe, Australia and Asia/Pacific. The Company operates through various apparel brands, including Hanes, Champion, Bonds, DIM, Bali, Maidenform, Playtex, Bras N Things, Nur Die/Nur Der, JMS/Just My Size, Wonderbra, Lovable, Alternative, Berlei, L’eggs and Gear for Sports. The Company operates through three segments: Innerwear, Activewear, and International. The Innerwear segment includes men’s underwear, women’s panties, children’s underwear and socks, and intimate apparel, such as bras and shapewear. The Activewear segment includes T-shirts, fleece, sport shirts, performance T-shirts and shorts, sports bras, thermals and teamwear. The International segment includes activewear, men’s underwear, women’s panties, children’s underwear, intimate apparel, socks, hosiery, and home goods. HBI’s current market cap is $5.3 billion.
Earnings and Sales Growth: Over the last twelve months, earnings increased by 15.79%, while revenues were -2.69% lower. In the last quarter, earnings declined by almost -17%, while sales slipped by -2.08%. HBI operates with a margin profile that suffered during the pandemic – which isn’t a big surprise given the conditions – but has shown signs of improvement over the past year. Over the last twelve months, Net Income as a percentage of Revenues was 1.14%, and increased in the last quarter to 3.43%.
Free Cash Flow: HBI’s free cash flow is a little more than $554 million, and translates to a useful Free Cash Flow Yield of 10.11%. The current number also marks an improvement over the past year from about $503 million, but declined from $684.6 million in the previous quarter.
Dividend Yield: HBI’s dividend is $.60 per share, which translates to an annual yield of about 3.82% at the stock’s current price. It is also worth noting that while many companies throughout the stock market suspended, reduced, or eliminated their dividends altogether early in 2020 to preserve cash, HBI has maintained their payout on a consistent basis throughout.
Debt to Equity: HBI has a debt/equity ratio of 4.73. This is a high number that does indicate they are highly leveraged, but also doesn’t tell the entire story. HBI’s balance sheet shows a little over $536 million in cash and liquid assets against about $3.3 billion in long-term debt. HBI’s margin profile is narrow, without a lot of margin for error, however it does indicate operating profits are adequate to service their debt load, with sufficient liquidity for the time being to provide additional flexibility. It should be noted that a reversal of the company’s current Net Income pattern could change this part of the company’s profile quickly, which is why it bears close watch if you choose to follow HBI.
Price/Book Ratio: there are a lot of ways to measure how much a stock should be worth; but I like to work with a combination of Price/Book and Price/Cash Flow analysis. Together, these measurements provide a long-term, fair value target at around $16 per share. That suggests HBI is somewhat undervalued right now, with 6% upside from its current price, and a practical bargain price at around $13 per share.
Technical Profile
Here’s a look at the stock’s latest technical chart.
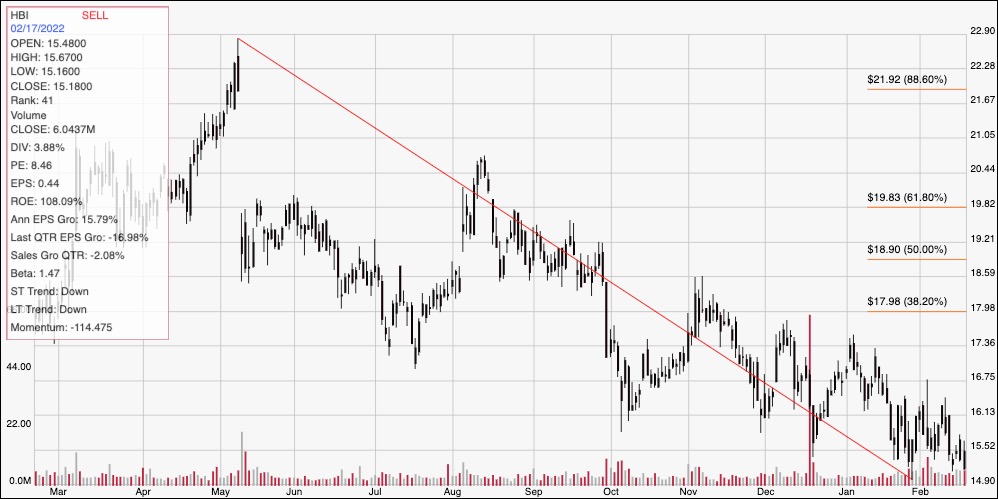
Current Price Action/Trends and Pivots: This chart traces the stock’s movement over the last year. The red line traces the stock’s downward trend since its peak in May of last year to to its 52-week low, reached in late January at around $15. It also provides the baseline for the Fibonacci retracement lines shown on the right side of the chart. The stock has mostly been consolidating so far this month, but has been tracing back towards its 52-week low to test current support at $15, with immediate resistance at $16. A push above $16 should find next resistance at around $17.50, while a drop below $15 could see the stock fall to a little below $14 before finding next support.
Near-term Keys: If you’re looking for a short-term, bullish trade, look for a push above $16 as a decent signal to buy the stock or to work with call options, with an eye on $17.50 as a practical exit target. If the stock breaks down below its current 52-week low, and you don’t mind trying to play what I think is pretty limited downside, you could consider shorting the stock or working with put options, with $13.50 to $14 providing a realistic, initial profit target on a bearish trade. What about value? I think HBI has some interesting fundamental strengths working in its favor right now, but it also seems to be a company working in a directly opposite direction as the rest of its industry, which is one of the reasons that I think the stock’s long-term trend is also directly contradictory to the momentum of many of its industry brethren. I would wait to see if the stock can begin to form a practical, new upward trend, with practical increases in Net Income, liquidity and Free Cash Flow, along with a reduction in debt before taking the stock seriously as a realistic, value-based opportunity.