(Bloomberg) — A pattern traced by the S&P 500 index’s volatility gauge is vindicating Wednesday’s dip-buyers.
The pattern stems from the futures curve for the Cboe Volatility Index, a gauge of implied equity swings for the U.S. benchmark derived from options trading.
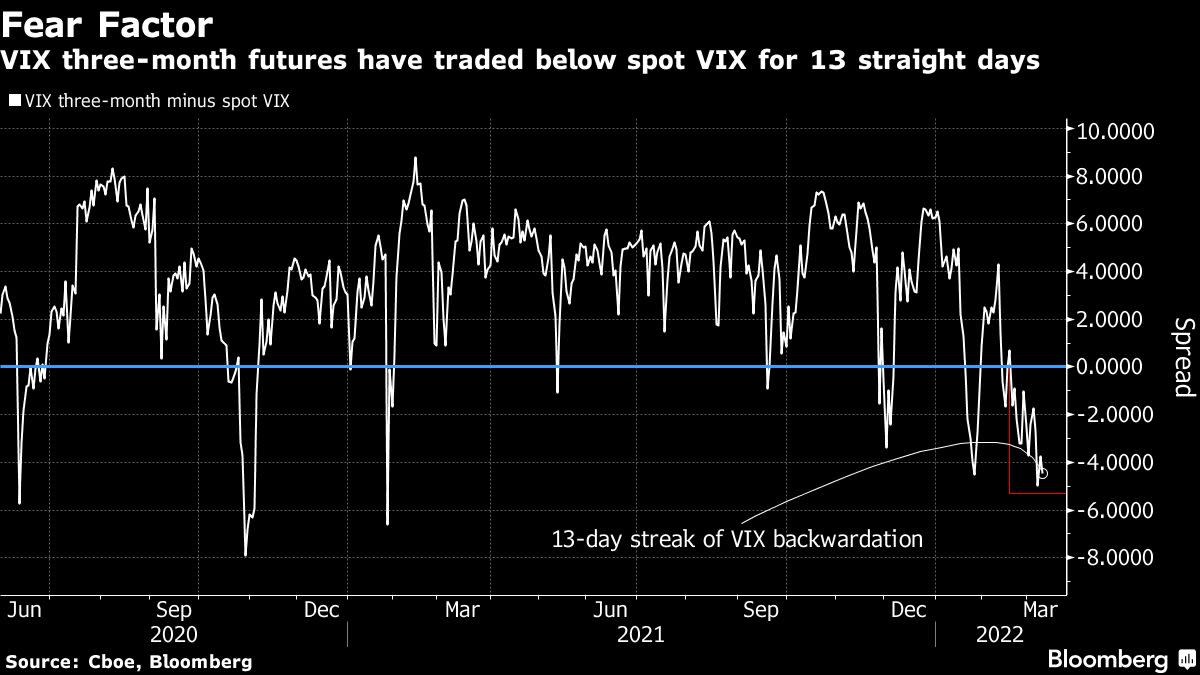
The curve has been in a prolonged backwardation, where shorter-term contracts are costlier than longer-dated ones. That structure is a sign that investors are unusually focused on current risks such as the war in Ukraine and attendant commodity-market disarray. Normally, the VIX curve slopes upwards.
Dip-buyers were in full force Wednesday, with U.S. stocks rebounding from a four-day selloff as tumbling oil prices spurred hopes the ban on Russian imports will have a less severe economic impact than feared.
The spot VIX has ended above the third-month contract for 13 straight days — the first time that’s happened in nearly two years. In the past decade, the S&P 500 returned an average 12.8% after 60 days following similar stretches of backwardation, according to data compiled by Bloomberg.
A VIX curve inversion “more often than not is an indication the selloff is approaching a near-term bottom” as the equity market digests stress, said Susquehanna International Group derivatives strategist Chris Murphy.
But he cautioned the inversion could also be a “false signal” if the S&P 500 is facing more than a “typical bull market pullback” of 12% to 15%. The S&P 500 is in a technical correction after sliding 13% from a record high in January.
Markets face an array of risks spanning war, Russia’s isolation from the global economy and a Federal Reserve interest-rate liftoff. If a recession alongside historic inflation starts looming, fears of a bear market would deepen. If not, bets on a recovery in equities could quickly multiply.
©2022 Bloomberg L.P.