In market and general news media, the last month has, not surprisingly been dominated by Russia’s invasion of Ukraine, with a couple of side notes about the long-term economic effect of increasing Western sanctions on Russia that helped spike oil and energy prices, and rising inflation. This month also saw the Federal Reserve raise its Fed Funds rate by 0.25%, a move they had signaled and that was expected, but that begs the question of whether a gradual pace and scale will be sufficient to curb inflation.
While consumer prices continue to increase across the board, there are other signs that the increase in rates is having an immediate impact; a recent report on monthly, pending home sales – measuring signed contracts on existing homes – fell 4.1% in February. That also marks the fourth straight month of declines in this metric. I take that as a sign not just of the effect of rising interest rates, but also a long-term residual effect of accelerated increases in real estate prices in multiple areas of the country of 25% or more in the last year alone. Price increases are also a symptom of a longer-term, supply chain problem that pre-dates, but has certainly been accelerated by the pandemic.
Those issues, along with healthy consumer demand combined to start increasing consumer prices in 2021, and given current conditions, it seems unlikely that prices will begin to come down in the near term. What does that mean for consumer goods? Today, I want to turn the focus to a company KTB spun off in 2019 using recognizable apparel brands Wrangler, Lee and Rock & Republic. This is a stock that saw a big push higher from October of 2020 to a little above $69 in May of 2021, then slid into a downward trend has extended into this month, hitting its most recent low a little below $40. It is now sitting just a little above that point and could trying to establish a new consolidation range. The company’s fundamental profile shows generally healthy free cash flow, manageable debt with good liquidity, and an attractive dividend. Are those elements enough to a provide a value proposition that you should be paying attention to? Let’s find out.
Fundamental and Value Profile
Kontoor Brands, Inc. is a global apparel company. The Company is focused on the design, manufacturing, sourcing, marketing, and distribution of its portfolio of brands, including Wrangler, Lee and and Rock & Republic. It sells its products primarily through its wholesale and digital channels. Its distribution channels include United States (U.S.) Wholesale, Non-U.S. Wholesale, Branded Direct-to-Consumer and Others. Wrangler offers denim, apparel, and accessories for men and women. Lee is a denim and apparel brand. Lee product collections include a range of jeans, pants, shirts, shorts, and jackets for men, women, boys and girls. Rock & Republic is a premium apparel brand. Rock & Republic products are sold in the United States exclusively through Kohl’s. It also owns and operates other various brands worldwide, which include Gitano and Chic. KTB has a current market cap of about $2.5 billion.
Earnings and Sales Growth: Over the last twelve months, earnings declined -28.46%, while revenues grew by a little over 3%. In the last quarter, earnings were -31.25% lower, while sales increased by 4.4%. KTB’s operating profile is generally healthy, but is showing some signs of weakness; over the last twelve months, Net Income was 7.9% of Revenues and decreased to 6.45% in the last quarter.
Free Cash Flow: KTB’s free cash flow is $247 million over the last twelve months. That marks a decline from $275.6 million in the quarter prior, but an increase from $179.58 million a year ago. The current number also translates to a Free Cash Flow yield of 9.9%.
Debt to Equity: KTB’s debt/equity ratio is high, at 5.34. That sounds alarming, but it is also misleading. As of the last quarter, the company reported $179.25 million in cash and liquid assets against $600 million in long-term debt – a number that declined from $773 million late in 2021. The company’s operating profile, along with generally healthy free cash flow suggest that servicing their debt isn’t a problem.
Dividend: KTB’s annual dividend is $1.84 per share, which translates to a yield of 4.23% at the stock’s current price. This is a bit unusual when you consider that the company has only existed as a public entity for about two years; I take the dividend as a positively inherited characteristic from parent company VFC, which has a long history of returning value to shareholders via consistent dividend distributions. The current annual payout also marks an increase from $1.60 per share, announced by management after its last earnings report.
Price/Book Ratio: there are a lot of ways to measure how much a stock should be worth; but I like to worth with a combination of Price/Book and Price/Cash Flow analysis. Together, these measurements provide a long-term target at about $36.50 per share. That suggests that despite the company’s fundamental strengths, the stock is overvalued by about -19%, with a bargain price around $28.50 per share.
Technical Profile
Here’s a look at the stock’s latest technical chart.
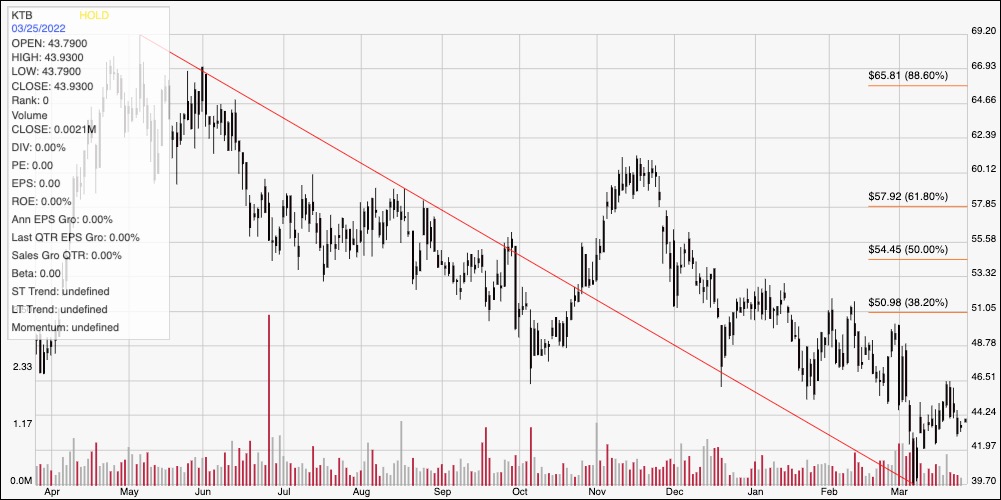
Current Price Action/Trends and Pivots: The red diagonal line traces the stock’s downward trend from a high at around $69 in May of last year to its low earlier this month at around $40. It also provides the baseline for the Fibonacci retracement lines shown on the right side of the chart. Whether the latest low is just another, temporary pause in the longer downward trend remains to be seen, but the last couple of weeks have seen the stock raise current support to about $42 based on pivot low activity, with immediate resistance at around $46.50. A push above $46.50 should see upside to between $49 and $51, where the 38.2% retracement should be expected to act as resistance, while a drop below $42 should revisit the stock’s 52-week low around $48, with potential to continue to about $38 if bearish momentum accelerates.
Near-term Keys: I think KTB’s fundamental profile, like its parent company in the face of the past year’s pandemic-induced economic conditions is a very interesting story – but unfortunately the stock’s current trend hasn’t pushed the stock low enough to translate to a useful value. The stock’s current activity could offer some interesting signals to work with short-term trades. A drop below $42 would offer a useful signal to consider shorting the stock or buying put options, with a useful bearish profit target at around $40 per share. A push above $46.50 would be a good signal to think about buying the stock or working with call options, with a practical bullish target at around $49, and possibly extending to $51.