The longer a bull market lasts, the more extended price valuations become. The longer that condition continues, the harder it becomes for value-oriented investors to justify long-term investments in most of the stocks, industries and sectors that everybody else is talking about. On the other hand, market downturns are things that tend to give value investors a lot more meat to chew on, as stocks in multiple sectors will begin to fall to more attractive price levels. It’s part of the reason that most bargain hunters also have quite a bit of a contrarian bent to them; when everyone else is looking for the exit, value seekers will hang around and take advantage of the opportunity to pick and choose the best from an ever-growing list of downtrodden stocks.
The irony of current market conditions is that a couple of weeks ago, with increasing interest rates on deck in response to high inflation and Russia’s brutal invasion of Ukraine taking the global center stage, a lot of investors and analysts were starting to call for a brand new bear market and recession.
The bear market hasn’t necessarily been averted, but seeing all three major indices in the U.S. bounce off of support near those levels (the NASDAQ 100 did drop below the -20% mark most analysts accept as the bear market benchmark) and drive higher over the last two weeks has at least quieted the angst and hang-wringing I was starting to see.
That doesn’t mean that economic and other, even more serious concerns aren’t still there – the Ukraine conflict doesn’t seem likely to end in the near future, and the West continues to look for some kind of middle ground between supporting Ukraine and not provoking Russia into more aggressive and more destructive action. That really just keeps Ukraine caught in the middle, which leaves a tragically grim outlook for that country no matter what or when the final outcome may be. On the economic front, sanctions against Russia designed to cripple their economy are simply adding to rising costs that start with the Energy sector but ripple into just about every other sector in one form or another. Against a generally grim backdrop, the market’s resilience and rally in the last two weeks is either inspiring or confusing. All told, the risk of a broad economic downturn really only seems to remain elevated, which to me means that serious bargain hunters should remain cautious and selective. There are opportunities out there – but simply seeing a stock in a protracted downturn does not automatically mean there is good value to be had.
One of the industries that you would expect to suffer during an economic downturn is Heavy Machinery. This is an industry in a sector, Industrials, that most analysts consider to be pretty cyclical; yet many of the largest companies in the sector – Caterpillar Inc. (CAT) and Deere & Co. (DE), for example – followed the movement of the major indices to new, multiyear highs in 2021 that made it seem easy to believe that business was better than ever. That perception even extended to smaller competitors, like Terex Corp (TEX); this is a stock that more than quadrupled in price from its pandemic-prompted, bear market bottom at around $12 in the first quarter of 2020 to its peak in May of last year at around $56. From that point, the stock has moved into a significant, long-term downward trend that found its latest low point at around $35 at the beginning of this month.
During the early stages of the pandemic and into 2021, companies like TEX saw a lot of bullish momentum in their stock prices from measures management chose to take to preserve capital and retain financial flexibility that larger companies may not have to take. In the case of TEX, slowdowns associated with the coronavirus pandemic prompted management to announce a suspension of its dividend, along with employee furloughs and reduced salaries for executives and cuts in production. The company’s earnings and Net Income through the last few quarters both reflect a significant impact from nationwide shutdowns and shelter-in-place orders. At the same time, the company clearly appears to have survived that storm, but are also in a good position to move with confidence into the future. That confidence is also manifest in the fact that in early 2021, management reinstated their dividend payout and increased in by $.04 per share, per annum after the last earnings report. What does that backdrop mean for the stock? Are the company’s fundamentals, along with the big decline in price enough to make the stock a good value? Let’s dive in and find out.
Fundamental and Value Profile
Terex Corporation is a manufacturer of lifting and material processing products and services that deliver lifecycle solutions. The Company has three business segments: Aerial Work Platforms (AWP), Cranes and Materials Processing (MP). It delivers lifecycle solutions to a range of industries, including the construction, infrastructure, manufacturing, shipping, utility, quarrying and mining industries. The AWP segment designs, manufactures, services and markets aerial work platform equipment, telehandlers and light towers. The AWP segment’s products are used by its customers to construct and maintain industrial, commercial and residential buildings and facilities, and for other commercial operations, as well as in a range of infrastructure projects. The Cranes segment’s products are used by its customers for construction and manufacturing facilities, among others. The MP segment’s products are used by its customers in construction, infrastructure and recycling projects. TEX’s current market cap is $2.6 billion.
Earnings and Sales Growth: Over the last twelve months, earnings increased nearly 290.5% (not a typo) while revenues rose almost 26%. In the last quarter, earnings were 22.4% higher, while sales growth was flat, but slightly negative, at -0.37%. TEX operates with a historically narrow margin profile that has rebounded from negative territory in the last few quarters and is showing signs of useful stabilization. In the last twelve months, Net Income was 5.68% of Revenues, and increased slightly to 5.92% in the last quarter. Narrow margins are not unusual in the Heavy Machinery industry, and given the nationwide shutdown of business operations from COVID-19, the fact this metric shifted from negative to positive Net Income in late 2021, along with the current levels is very encouraging.
Free Cash Flow: TEX’s free cash flow spent most of 2020 and 2021 under pressure. After improving late in 2021, this metric declined in the last quarter; over the last twelve months, Free Cash Flow was $235.6 million – down from $409 million a year ago, $553.2 million in the quarter prior and significantly below the $1.3 billion high-water mark of the last quarter of 2019. The current number translates to a Free Cash Flow Yield of 8.94%.
Debt to Equity: TEX has a debt/equity ratio of .6, a number that suggests a conservative approach to debt management, and dropped from .84 in the quarter prior. Their balance sheet shows $266.9 million in cash and liquid assets against about $668.5 million in long-term debt. It is worth noting that in early 2021, long-term debt was $1.16 billion, and $888.5 in the last quarter of the year, making the reduction significant.
Dividend: TEX resumed its dividend payout in 2021 at $.48 per share, per year and then increased it again after the latest earnings announcement, to $.52 per share. At the stock’s current price, that translates to a dividend yield of 1.38%, which doesn’t sound too impressive; but the reinstatement, and increase in and of itself is a significant indication of management’s confidence moving forward.
Price/Book Ratio: there are a lot of ways to measure how much a stock should be worth; but I like to work with a combination of Price/Book and Price/Cash Flow analysis. Together, these measurements provide a long-term, fair value target at about $35 per share. That means the stock is somewhat overvalued at its current price, with -5% downside, and a practical discount price sitting back at around $28 per share. This is also a metric that put a long-term “fair value” price at around $44 per share late in 2021.
Technical Profile
Here’s a look at the stock’s latest technical chart.
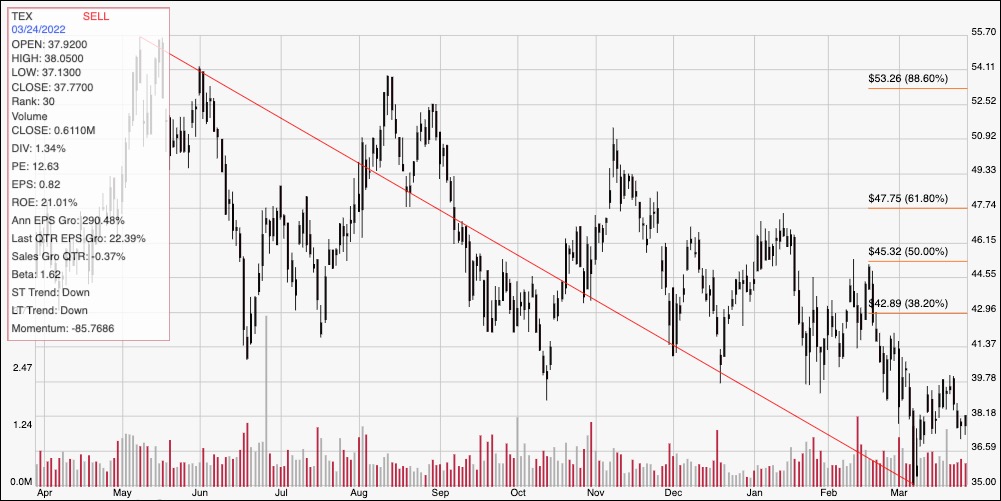
Current Price Action/Trends and Pivots: The red diagonal line measures the length of the stock’s downward trend from May of last year to its low earlier this month at around $35. It also provides the baseline for the Fibonacci retracement levels shown on the right side of the chart. After hitting its latest low, the stock rallied to find immediate resistance at around $40 last week. The stock has dropped from that point, but could looks to have current support at around $36.50. A drop below that level should have limited immediate downside with the stock’s 52-week low at around $35, but if bearish momentum picks up and pushes below that point, it could fall to about $30 (based on the distance between the last support fail and next support) before finding new support. A push above $40 could find next resistance at around $41, and $43 providing additional resistance beyond that point if buying activity starts to accelerate.
Near-term Keys: The balance sheet for TEX has held up reasonably well for the past year, considering the challenges the company has been dealing with, and is a sign of management’s strength. Even so, the latest declines Free Cash Flow and liquidity are only partially offset by decreasing, manageable debt along with the reinstatement and increase of the stock’s quarterly dividend, given broader market conditions that I think will continue to keep pressure on the economy and the Industrial sector specifically. From a valuation standpoint, that means that the stock would have to drop to around $28 before I would consider it as a useful value opportunity. That also means the best probabilities lie with short-term trades. Use a push above next resistance at $41 as an opportunity to think about buying the stock or working with call options, with a near-term target price at around $43. A drop below $35 might be a good signal to consider shorting the stock or buying put options, with next expected support at around $30 providing an attractive profit target on a bearish trade.