As an analyst, one of the things that facilitates my ability to screen the market is the way that sectors and industries are organized. That’s because it makes it easier to think about the different pockets of the economy that might fit current conditions at any given time. It also makes it easier to put the operations of individual companies into a describable context.
That categorization, and the ease of context it helps to provide gets challenged when you start to think about a lot of the “Big Boys” in the global business world. Many of the largest companies in the world aren’t just leaders in their respective, designated industries, but in multiple business segments that can span multiple different industries. We like to use the word “conglomerate” to describe a lot of these behemoths simply because they have a major presence in every market they choose to operate.
Comcast Corp (CMCSA) is a good example of what I mean. When I hear the name “Comcast,” my mind tends to go directly to their original business, cable television broadcasting, but that is really just the tip of the iceberg this company has become. Recognizing long ago the deteriorating nature of the cable television market in the face of intense emerging competitors from satellite broadcasting to streaming media, Comcast has used acquisition as a primary driver for growth. Cable television might be a dying breed, but the company’s acquisition of NBC Universal gave it an immediate, leading position in broadcast television (NBC properties including CNBC, MSNBC, NBC, and Telemundo), filmed entertainment, and theme parks both under the Universal umbrella). They have also pushed to diversify their cable business to include broadband and wireless telecommunication services, in part to offset gradual, long-term declines in its cable subscriber base.
Since hitting a peak in September 2021 at around $62 per share, the stock has dropped into a long-term, downward trend that appears to have found a bottom in late February at around $44 per share. That’s a decline of about -23.5% to its current price just a little above that low, putting the stock in its own bear market; but the stock’s ability to stabilize in March and start to rebound to its current level around $47 also begs the question whether the stock might now represent an attractive, new value-driven opportunity. The company’s fundamental strengths include robust operating margins, healthy cash flow, and plenty of cash and liquid assets, and a dividend that is roughly in-line with the S&P 500 average. Should you be considering the stock as a new investing opportunity? Let’s look at the numbers so you can decide for yourself.
Fundamental and Value Profile
Comcast Corporation is a media and technology company. The Company has two primary businesses: Comcast Cable and NBCUniversal. Its Comcast Cable business operates in the Cable Communications segment. Its NBCUniversal business operates in four business segments: Cable Networks, Broadcast Television, Filmed Entertainment and Theme Parks. Its Cable Communications segment consists of the operations of Comcast Cable, which provides video, high-speed Internet and voice services to residential customers under the XFINITY brand. Its Cable Networks segment consists of a portfolio of national cable networks. Its Broadcast Television segment operates the NBC and Telemundo broadcast networks. Its Filmed Entertainment segment primarily produces, acquires, markets and distributes filmed entertainment across the world, and it also develops, produces and licenses live stage plays. Its Theme Parks segment consists primarily of its Universal theme parks in Orlando, Florida and Hollywood, California. CMCSA has a current market cap of about $215.5 billion.
Earnings and Sales Growth: Over the last twelve months, earnings increased by 37.5%, while revenues increased about 9.5%. in the last quarter, earnings declined by -11.5% while sales were flat, but positive at 0.13%. The company’s margin profile is healthy, but showing some signs of deterioration. In the last quarter, Net Income as a percentage of Revenues was 10.07% versus 8.87% over the last twelve months.
Free Cash Flow: CMCSA’s free cash flow is healthy, at about $19 billion, and marks an improvement from around $16.3 billion in the quarter prior and $15.9 billion a year ago. That translates to a Free Cash Flow Yield of 8.87%.
Debt to Equity: CMCSA’s debt to equity is 1, which is high, but not unusual for stocks in the same industry. The company’s balance sheet indicates operating profits, should be adequate to service their debt, although long-term debt is very high. In the last quarter, CMCSA showed about $8.7 billion in cash and liquid assets in the last quarter versus almost $97.88 billion of long-term debt.
Dividend: HFC’s annual divided is $1.08 per share (up from $.92 per share about a year ago), which translates to a yield of about 2.29% at the stock’s current price.
Price/Book Ratio: there are a lot of ways to measure how much a stock should be worth; but I like to work with a combination of Price/Book and Price/Cash Flow analysis. Together, these measurements provide a long-term, fair value target at about $52.50 per share. That means the stock is trading at a decent, but not compelling discount, with about 12% upside from the stock’s current price. It is also worth noting that about a year ago, this same analysis yielded a long-term target price at around $47 per share. The stock’s compelling discount level is current at around $42 per share.
Technical Profile
Here’s a look at the stock’s latest technical chart.
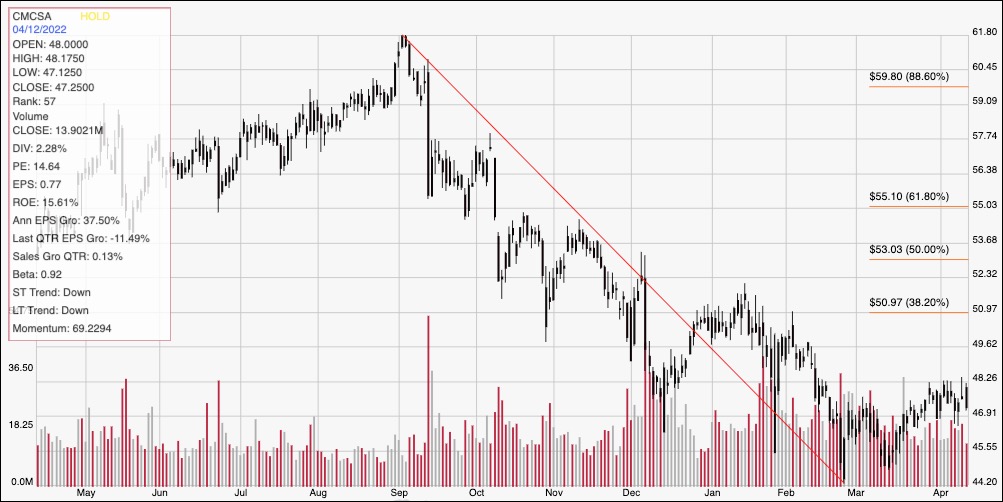
Current Price Action/Trends and Pivots: The chart above covers the last year of price activity. The red line traces the stock’s downward trend from its peak in September 2021 at about $62 to its low at the end of February at around $44. It also provides the baseline for the Fibonacci retracement lines shown on the right side of the chart. From its low, the stock has rebounded modestly to its current price a little below $48. Immediate resistance is around $48 based on the last week of pivot high activity, with current support at around $47. A drop below $47 should see the stock find next support between $44 and $45 per share, while a push above $48 should find next resistance at around $51, where the 38.2% retracement line waits.
Near-term Keys: The stock’s downward trend has pushed the stock down to levels that are starting to look attractive for a potential value-based investment. The last quarters’ dip in Net Income is a red flag, but could also be a cyclical element that will resolve in the quarters ahead. If you prefer working with short-term trading strategies, a drop below $47 could be a signal to think about shorting the stock or buying put options, with an eye on the quick exit target at around $44 per share. The stock’s more recent bullish momentum means that a push above $48 could be a good signal to consider buying the stock or working with call options; in that case, don’t be shy about taking profits quickly if the stock approaches $51. While the stock isn’t a compelling value right now, a drop to around $42 could offer an interesting opportunity in the long-term in one of the largest companies in the Media industry.