Sometimes, answering the question of whether a stock represents a legitimate, attractive value opportunity can be hard to do. A company could be struggling not only to grow its business, but may be forced to restructure its business in a way that makes most of the traditional measurables investors like to use look very unfavorable. Strict, quantitative value and fundamental analysis would dictate that you stick to the numbers, and that you distrust anything but what the numbers tell you. That isn’t always the most sensible thing to do, however simply because business isn’t always just about the numbers.
It isn’t that the numbers – sales, earnings, free cash flow, debt, and so on – aren’t important, because of course they always are. They help to frame a company’s business over any given period of time in a useful context. Sometimes, however, you also need to be able to look beyond the limits of what that context may describe.
It can be important to remember that the numbers that make up fundamental and value-based metrics are almost always historical in nature; even forward-looking measurements and estimates tend to rely on past performance to provide a framework for what a company might be able to do in the future. This is really where one of the challenges of stock market and value-based analysis is greatest, because this is really more art than science.
To add even more complication to the mix, broader economic conditions naturally play a role in this analysis. Some segments of the economy are more sensitive to the ebb and flow of economic growth, and so a smart investor tries to understand where the stock you may be considering fits into the overall economic picture. If you’re paying attention to stocks in the Energy sector, for example, you need to understand that in the broadest sense, these stocks are tied directly to crude oil, natural gas, and other energy-related commodity prices. Stocks in the Consumer Staples sector, on the other hand, like Food Products tend to be a bit less sensitive to economic fluctuations simply because even when the economy may be contracting, consumers still have to stock their pantries and fridges.
With the idea of economic cyclicality in mind, let’s think about the Consumer Discretionary sector. This is a sector that tends to be more sensitive to broad economic conditions, and if you drill into some of the industries in the sector, you start to understand why that tends to the case. The Retail Specialty industry takes in a pretty wide swath of company types that includes the kinds of focused, specialized retail stores you’ll commonly find at the mall. Even more to the point, when you start thinking about specialists like jewelers, I think the picture becomes even more clear. When factors like unemployment are high, and incomes are dropping, shopping for diamond jewelry becomes a lot harder for the average consumer.
2022 has marked a change from the very accommodative monetary policy the Fed has used throughout the past two years to support the economy during the COVID-19 pandemic. As consumer activity has increased, consumer prices have risen faster than many expected, marking inflationary levels that haven’t been seen in the last 40 years. To add fuel to the inflation fire, Russia’s invasion of Ukraine, unsurprisingly sparked a wave of outrage in the West that led to broad-based sanctions against Russian exports, including natural gas and crude oil from that region that is further restricting supply and keeping prices for those energy products elevated.
For specialty retailers like Signet Jewelers Ltd (SIG), the likelihood that inflation will remain high means that these stocks may be exposed to a higher level of broad market risk than other stocks. That is part of the reason that the stock has dropped nearly -30% from its November 2021 high at around $112. This is a company with a fortress-level balance sheet that features very low, manageable debt and healthy liquidity as well as Free Cash Flow. The real question now is whether the stock’s drop from its high makes it a useful value now. If it does, do broader market and economic conditions justify the risk? Let’s try to find out.
Fundamental and Value Profile
Signet Jewelers Limited is a Bermuda-based retailer of diamond jewelry. The Company operates approximately 2,800 stores primarily under the name brands of Kay Jewelers, Zales, Jared, H.Samuel, Ernest Jones, Peoples Jewellers, Banter by Piercing Pagoda, JamesAllen.com, Diamonds Direct and Rocksbox. It offer clients an unmatched range of products in rounds, pears, marquise, princess, emerald, cushion and heart shaped diamonds.SIG’s current market cap is $3.9 billion.
Earnings and Sales Growth: Over the last twelve months, earnings increased by 20.7%, while sales improved by about 28.6%. In the last quarter, earnings increased by more than 250%, while sales were almost 83% higher (these numbers are not typos). The company’s historically narrow operating profile has been improving throughout the past year and offers a bit of a counterpoint to the broader, bearish economic picture. Over the last twelve months, Net Income was 9.84% of Revenues, and increased in the last quarter to 11.18%.
Free Cash Flow: SIG’s free cash flow is very attractive, at about $1.13 billion for the trailing twelve month period; that translates to a Free Cash Flow yield of more than 29.6% and validates from the company’s strengthening margin profile. It also marks an improvement from $967 million at the end of 2020, but has declined from $1.5 billion three quarters ago.
Debt to Equity: SIG has a debt/equity ratio of .09, which indicates the company employs a conservative philosophy about leverage and speaks in part to the company’s fortress-level balance sheet. For perspective, consider that in late 2018, SIG held only about $134 million in cash and liquid assets versus $671.1 million in long-term debt. As of the last quarter, cash and liquid assets were a little over $1.4 billion while long-term debt was just $147 million – down from $1.03 billion to begin 2021. It appears clear that management borrowed heavily at the beginning of 2020 to bolster its balance sheet against the broader declines it anticipated in the wake of the pandemic, as long-term debt jumped from a little over $500 million at the beginning of 2020 to a peak two quarters later at $1.33 billion. Considering that practically all of those obligations are no longer on the books, it’s easy to see why SIG’s balance sheet is a major strength.
Dividend: SIG suspended its dividend in early 2020 to preserve cash, but reinstated it in mid-2021 at a rate of $.72 per share, and increased it to $.80 per share, per annum after the latest earnings announcement. That is modest, translating to an annualized yield of just 1.05%, but the reinstatement, followed by increase is still a declaration of management’s confidence in the future.
Price/Book Ratio: there are a lot of ways to measure how much a stock should be worth; but I like to worth with a combination of Price/Book and Price/Cash Flow analysis. Together, these measurements provide a long-term target at about $63 per share. That suggests that the stock is overvalued right now, with about -19% downside to its fair value price, and a practical discount price sitting at around $51 per share. It should also be noted that at the end of 2021, this same analysis yielded a fair value target at around $85 per share.
Technical Profile
Here’s a look at the stock’s latest technical chart.
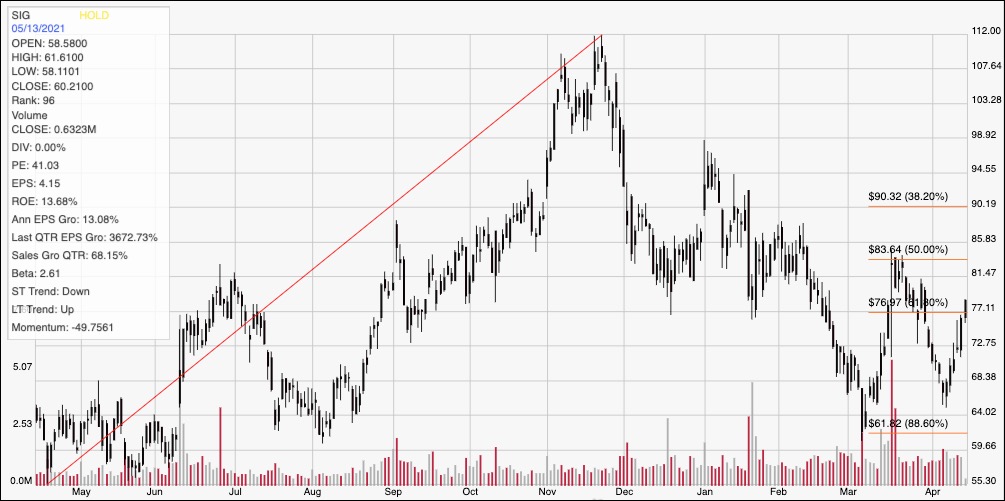
Current Price Action/Trends and Pivots: The chart above traces the stock’s price activity over the last year. The red diagonal line traces the stock’s upward trend from its low at around $55 last May to its peak in November at $112. It also provides the baseline for the Fibonacci retracement lines on the right side of the chart. After finding a bottom in early March of this year at around $65, the stock rallied to about $83.50 before dropping back again to confirm support at $65. The stock has rallied to about $78 since then, and pushing above the 61.8% retracement to mark current support at around $77, with immediate resistance expected at the last peak at around $83.50. A push above resistance should find new resistance at around $90, where the 38.2% retracement line sits, while a drop below $77 should see the stock fall back to around $65 before finding new support.
Near-term Keys: The stock’s strong long-term bullish trend pattern makes SIG a tempting stock to consider using for a bullish trade – but with the stock very near to current support and only about $5.50 of upside to next resistance to about $12 of downside to next resistance, you should use very narrow stops. You could use the current push above $77 as signal to buy the stock or work with call options with a bullish target at around $83.50 as long as you move quickly to limit losses if the stock drops back below $77. A drop below $77 would act as a strong bearish signal to consider shorting the stock or buying put options, with downside to about $65. What about the value proposition? The company’s fundamentals are strong enough, with signs that profitability and financial capacity is improving; however, the value proposition simply doesn’t exist right now. With current conditions as they are, I think the smart approach for a value investor is to tuck SIG onto a watchlist and come back to it later.