A primary economic theme for 2022, no matter whether you start the conversation by talking about the long-term impact of the pandemic, labor shortages, monetary policy, or the devastating conflict in Ukraine really boils down to inflation. Economic metrics were clearly starting show that inflation was picking up steam in late 2021, and this year has only confirmed that fact even more, with multiple indicators showing levels that haven’t been seen in four decades.
The first, and most obvious impact inflation has on the economy is on interest rates. As the primary tool central banks in a market-driven economy to influence economic growth, rising interest rates are the first level that usually gets pulled when the Fed decides it needs to slow down the pace of inflation. Sure enough, last month saw the first rate increase since before the pandemic, with several additional increases forecast through the rest of the year, with the scale of each incremental increase also expected to be higher.
With consumer prices already high, and the spectre of rising interest rates now a functional reality, the normal expectation is that consumer demand for discretionary goods and services should decline. The net result is an increase in an economic uncertainty that still has the market looking for a firm foothold to define its direction for the rest of the year.
Economic uncertainty may blunt some of the enthusiasm for industries tied to stocks in industries that are considered “discretionary,” or sensitive to the ebb and flow of economic growth. For contrarians like me, the irony of that gloomy forecast is that it also opens up the potential to start finding stocks in those pockets of the market that could mark the best bargains, since declining stock prices may not directly correlate with a company’s fundamental strength. That’s why, even as others may look to avoid economically sensitive sectors and industries, I usually start to put even more focus on them than I might do under normal conditions.
That brings me to today’s highlight. Levi Strauss & Co. (LEVI) is a name most of us in North America – and even a big part of the world – are familiar with, a brand that I think speaks as much to Americana as country music and apple pie. This is a stock that has been following a strong downward trend for the past year, falling from a 52-week high at around $31 to a March low around $17. Since then, the stock has been rallying and could be settling into a consolidation range in advance of an eventual trend reversal. With a fundamental profile that points to healthy liquidity, manageable debt, and solid profitability, this might be a stock that is also offering a useful, value-oriented opportunity Let’s dive in.
Fundamental and Value Profile
Levi Strauss & Co. is an apparel company. The Company designs, markets and sells directly or through third parties and licensees products that include jeans, casual and dress pants, tops, shorts, skirts, jackets, footwear and related accessories for men, women and children under the Levi’s, Dockers, Signature by Levi Strauss & Co. and Denizen brands. The Company operates through three segments: the Americas, Europe, and Asia. Its Asia segment includes the Middle East and Africa. The Company’s products are sold in approximately 50,000 retail locations in more than 110 countries, including approximately 3,000 brand-dedicated stores and shop-in-shops. It has approximately 1,039 Company-operated stores located in 36 countries and approximately 500 Company-operated shop-in-shops. The remainder of its brand-dedicated stores and shop-in-shops are operated by franchisees and other partners. LEVI’s market cap is around $7.9 billion.
Earnings and Sales Growth: Over the last twelve months, earnings increased by 35.3%, while revenues grew almost 22%. In the last quarter, earnings grew by about 12.2% while sales declined by -5.5%. LEVI’s operating profile is healthy and strengthening; over the last twelve months, Net Income was 10.03% of Revenues and increased to 12.3% in the last quarter.
Free Cash Flow: LEVI’s free cash flow is healthy, at $550.37 million over the last twelve months. That marks a slight decline from $578.25 million three quarters ago, but an increase from $218.24 million a little over a year ago.
Debt to Equity: LEVI’s debt/equity ratio 0.59. This is a low number that speaks to management’s conservative approach to leverage. As of the last quarter, the company reported $777.15 million in cash and liquid assets against about $1.02 billion in long-term debt. While the company’s operating profile indicates that debt service isn’t a concern, the fact is that liquidity has decreased, from $901.82 million in the quarter prior and a little under $1.5 billion three quarters ago.
Dividend: LEVI’s annual divided is $.40 per share, which translates to a yield of 2.02% at the stock’s current price.
Price/Book Ratio: there are a lot of ways to measure how much a stock should be worth; but I like to worth with a combination of Price/Book and Price/Cash Flow analysis. Together, these measurements provide a long-term target at about $26 per share. That suggests that the stock is nicely undervalued by about 30% upside from its current price.
Technical Profile
Here’s a look at the stock’s latest technical chart.
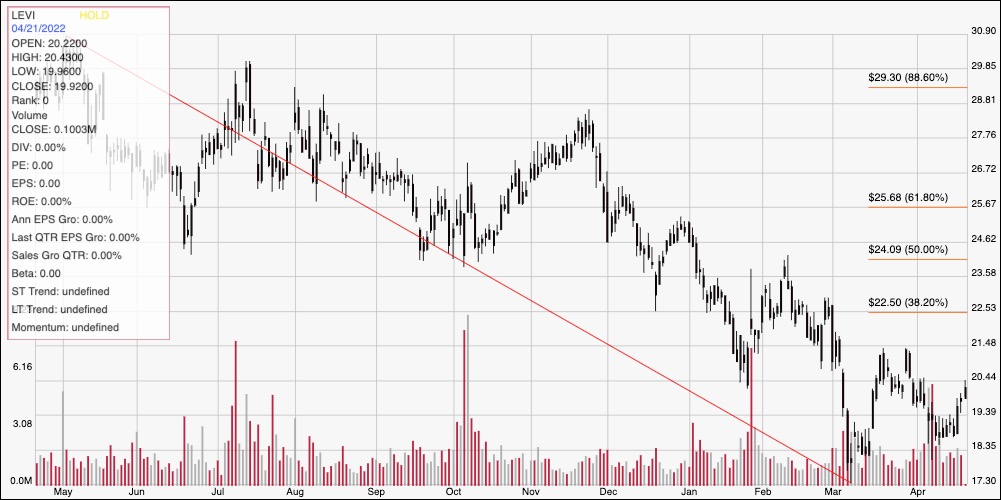
Current Price Action/Trends and Pivots: The red diagonal line traces the stock’s downward trend from a peak at around $31 in May of last year to its March low at around $17. It also provides the baseline for the Fibonacci retracement lines shown on the right side of the chart. From that low point, the stock rallied to a temporary peak at around $21.50, marking immediate resistance at that level, with current support at around $18.50 based on a pivot low established late last week. A drop below $18.50 should test the stock’s 52-week low at around $17, while a push above $21.50 has limited upside, to about $22.5 0 before finding next resistance around the 38.2% retracement line. A push above that line would mark a likely bullish trend reversal, with upside from that point expected at about $25.50 where the 61.8% retracement line sits.
Near-term Keys: I think LEVI’s fundamental profile offers an interesting value proposition at its current price. Declining liquidity is a concern, and could be a reflection of both long-term debt reduction as well as rising material and other input costs. The quarters ahead will provide a better indication, given the company’s improving Net Income as to whether that is a cyclical concern or longer-term in nature. The stock’s current activity could offer some interesting signals to work with short-term trades. A drop below $18.50 could offer a useful, if limited signal to consider shorting the stock or buying put options, with a practical, quick-exit bearish profit target at around $17 per share. A push above $21.50 could offer a somewhat speculative signal to think about buying the stock or working with call options, with a practical bullish target at around $22.50, and $25.50 if buying momentum accelerates.