In the first quarter of 2022, broad market commentary has shifted from the pandemic-driven questions and concerns that defined most of 2020 and all of 2021. The after-effects of monetary and stimulus policies that pumped money into the economy during the worst of the pandemic began to show clear signs of cost inflation, not only on producers but also for consumers. The pace of inflation has become the dominant theme of this year, as the Fed is raising interest rates and the conflict in Ukraine puts pressure on global energy markets while it also prompts long-term geopolitical questions about the region and Russia’s increasing isolation from the West.
One pocket of the economy that really took a big hit during the pandemic is big-box department stores. While other specialty retailers found ways to adjust, absorb the negative impact that initial shutdowns imposed and emerge hopefully better equipped for the future, department stores like Kohl’s Corporation (KSS) were already struggling to adjust to shifting consumer preferences towards online shopping and reliance on private labels and brands before the pandemic began. KSS borrowed heavily to bolster its cash and liquid assets early during the pandemic, which enabled the company to absorb much of the blow they took from an extended shutdown period.
The company’s most recent earnings reports shows that a number of important fundamental metrics, including Free Cash Flow and cash and liquid assets saw material improvements in 2021 and that are still in pretty good shape, with a very healthy balance sheet. That looks like a good sign that the company has not only survived the worst, but also turned the corner to profitability and is in good position to respond to whatever conditions – good or bad – lie ahead. The market has responded to those solid indications of strength by pushing the stock from an October 2021 low at around $43.50 to a peak in mid-march at around $63. The stock has drifted a little lower from that point, but also appears to be forming a narrowing consolidation pattern that could imply the stock is about to make a new move. What does the stock’s increase from the end of last year mean for the stock’s value proposition? Could it sill offer a practical value, even at its current price? Let’s find out.
Fundamental and Value Profile
Kohl’s Corporation (Kohl’s) is an operator of department stores. The Company operates approximately 1,154 Kohl’s department stores, a Website (www.Kohls.com), approximately 12 FILA outlets, and approximately three Off-Aisle clearance centers. The Company’s stores and Website sell moderately-priced private label and national brand apparel, footwear, accessories, beauty and home products. The Company’s Website includes merchandise that is available in its stores, as well as merchandise that is available only online. The Company’s merchandise mix includes both national brands and private brands that are available only at Kohl’s. The Company’s private brands include Apt. 9, Croft & Barrow, Jumping Beans, SO and Sonoma Goods for Life. The Company’s exclusive brands include Food Network, Jennifer Lopez, Marc Anthony, Rock & Republic and Simply Vera Vera Wang. KSS’s current market cap is $7.6 billion.
Earnings and Sales Growth: Over the last twelve months, earnings were mostly flat, but decreased by -0.9%, whiles sales increased 5.83%. In the last quarter, earnings increased by about 33.33%, while sales improved by 41.28%. The company’s margin profile has historically been narrow, which does represent a risk element of which to be cautious, but has reversed the pattern of negative Net Income of 2020 and is showing solid signs of stabilization. Over the last twelve months, Net Income was 4.83% of Revenues, and weakened only slightly to 4.6% in the last quarter.
Free Cash Flow: KSS’s free cash flow is healthy, at $1.7 billion. That marks an increase from about $1.5 billion a year ago, but did drop from $2.4 billion three quarters ago. The current number translates to a very healthy Free Cash Flow Yield of 20.65%.
Debt to Equity: KSS has a debt/equity ratio of .87. Cash and liquid assets were about $1.587 billion in the last quarter, a decrease from $2.56 billion three quarters ago, while debt increased from $400 million in the middle of 2018 to $1.9 billion in the most recent quarter. This number has declined from $3.4 billion about a year ago, which I think confirms their ability to pay down debt (the company borrowed heavily at the onset of the pandemic, pushing long-term debt to more than $6 billion) while increasing liquidity and is a big reason management announced the resumption of dividend distributions in the first quarter of 2021.
Dividend: KSS reinstated its dividend in the first quarter of 2021 at a rate of $1.00 per share, and then raised it another $1.00 per share, per year. The current $2.00 per share annual payout translates to a useful annualized dividend yield of 3.38% at the stock’s current price.
Price/Book Ratio: there are a lot of ways to measure how much a stock should be worth; but I like to work with a combination of Price/Book and Price/Cash Flow analysis. Together, these measurements provide a long-term, fair value target around $58 per share. That suggests that the stock is fairly valued right now, with a practical discount price at around $46.50.
Technical Profile
Here’s a look at the stock’s latest technical chart.
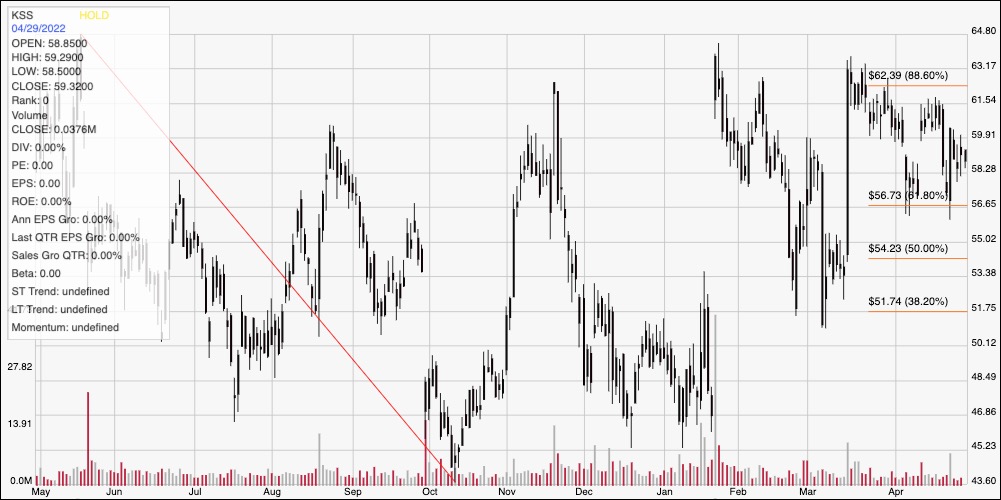
Current Price Action/Trends and Pivots: The chart above shows the last year of price movement for KSS. The red diagonal line traces the stock’s downward trend from may of last year, at a high around $65 to its low in October at around $43.50. It also provides the baseline for the Fibonacci retracement lines shown on the right side of the chart. The stock’s upward trend from that point has seen pretty wide swings from high to low, but peaked in January at around $64 and hit roughly $63 in mid-March. The stock has been retracing from that March high, but also seen consistent, current support at around $57, a little above the 61.8% retracement line. Immediate resistance is sitting at around $61.50 based on a pivot high a little over a week ago.
Near-term Keys: KSS’s drop in the last month and a half could be setting up an interesting swing-trading opportunity, as the stock is narrowing its trading range and forming a wedge pattern that could signal an upcoming breakout. If the stock pushes above $61.50, consider buying the stock or working with call options, using $63 to $64 as useful, bullish profit targets. A drop below $57 could be a signal to think about shorting the stock or buying put options, with next support sitting at around $53.50 providing a useful exit point on a bearish swing trade. The stock’s trend since October does mean that it doesn’t offer a practical value at its current price, which means that if you’re looking for a good, long-term value, you should tuck KSS away for now and check back again after the next earnings report.