Through most of the past two years, one of the surprising stories is the way that a lot of traditional, brick-and-mortar retail companies found creative ways to shift their operations to work in a COVID-restricted world. Along with unprecedented stimulus like extended unemployment benefits that shielded a lot of Americans from the worst economic impacts of shelter-in-place orders and social distancing restrictions, these companies found ways to leverage technology to expand omnichannel sales and delivery methods that helped to keep demand for their goods healthy throughout the pandemic. As a result, many of these companies bucked the expectation of slowing sales and profitability to demonstrate healthy balance sheets, robust cash flows, and improving operating margins.
The latter part of 2021, and certainly the first four months of this year have shifted the narrative a bit away from COVID and onto the reality that those same stimulus programs pushed inflation to levels not seen in the last four decades. Issues that existed prior to the pandemic, like limited chip supply in the Semiconductor industry, along with concerns that began with the health crisis, like labor shortages have all compounded to create extended supply chain issues that have helped to push inflation indicators even higher. Add to the mix Russia’s invasion of Ukraine that they are now beginning to call a war with the West, and you have a pretty toxic mix of global economic issues that have led to rising consumer costs. Those have risen to the point that I’ve started to see forecasts from some economists and experts that suggest that the rising costs of basic goods – which are not being offset by a rise in income – should translate to lower disposable income. If that is true, it should act as a leading indicator of declining economic activity. That threatens to shift the conversation from rising inflation to the next-most-scary economic cycle, deflation.
The economic questions I’ve just described put Specialty Retail industry in what could be a dangerous spot, which is why it isn’t too surprising that a lot of well-known names in the industry are significantly below their 2021 highs. That includes Best Buy Co (BBY). While in-store operations were severely impacted during the pandemic, the company found creative methods not only to keep selling products, but also to stay in contact with its customers on a local level. Modifying their existing options to buy or pick up orders in-store, BBY took advantage of parking stalls that were longer being occupied by in-store shoppers to make them available for drive-up, pick-up service. This is just one simple example of the kinds of things BBY was able to do to keep a number of its stores open during the worst of the pandemic.
BBY also resides in an intensely competitive landscape that was already fierce, but that has been under more and more pressure for a number of years from inroads made by Amazon (AMZN) in its digital and technology-centric offerings while still facing intense competition from big-box retailers like Walmart (WMT) and Target (TGT). That is a symptom of what has become a clear, long-term, “sea change” kind of shift by consumers away from traditional brick and mortar stores to online shopping alternatives. BBY has been working hard to stay relevant amidst that change, and many of those changes are what enabled the company to succeed during the last two years. This is a company with some interesting fundamental strengths including an outstanding balance sheet, healthy free cash flow and an attractive dividend. The stock has dropped nearly -36% from its most recent, November 2021 peak and appears to be looking for a new, stabilizing support level. Does that drop represent an opportunity to get in at a good value price for long-term investors, or would it smarter to wait? Let’s find out.
Fundamental and Value Profile
Best Buy Co., Inc. is a provider of technology products, services and solutions. The Company offers products and services to the customers visiting its stores, engaging with Geek Squad agents, or using its Websites or mobile applications. It has operations in the United States, Canada and Mexico. The Company operates through two segments: Domestic and International. The Domestic segment consists of the operations in all states, districts and territories of the United States, under various brand names, including Best Buy, bestbuy.com, Best Buy Mobile, Best Buy Direct, Best Buy Express, Geek Squad, Magnolia Home Theater, and Pacific Kitchen and Home. The International segment consists of all operations in Canada and Mexico under the brand names, Best Buy, bestbuy.com.ca, bestbuy.com.mx, Best Buy Express, Best Buy Mobile and Geek Squad. As of December 31, 2016, the Company operated 1,200 large-format and 400 small-format stores throughout its Domestic and International segments. BBY’s market cap is $20.7 billion.
Earnings and Sales Growth: Over the last twelve months, earnings declined by -21.55%, while also dropped by -3.38%. In the last quarter, earnings increased by 31.25% while sales increased by 37.41%. BBY operates with a very narrow margin profile that has weakened somewhat. Over the last twelve months, Net Income was about 4.74% of Revenues, and dropped in the last quarter the number to 3.83%.
Free Cash Flow: BBY’s Free Cash Flow over the last twelve months was $2.5 billion. That translates to a Free Cash Flow Yield of 12.43%. It does mark a decline from $3.5 billion a year ago, but increased from $1.34 billion in the quarter prior.
Debt to Equity: the company’s debt to equity ratio is .40, a very low number that reflects the company’s biggest strength, which can be seen in its balance sheet, which shows about $2.9 billion in cash and liquid assets against roughly $1.2 billion in long-term debt. Their healthy cash position, along with extremely manageable debt is a significant reversal from their position prior to the pandemic, when long-term debt was much higher than cash.
Dividend: BBY pays an annual dividend of $3.52 per share, which translates to an annual yield of about 3.91% at the stock’s current price. It’s worth noting that BBY has increased their dividend from $2.00 at the end of 2019, $2.10 in 2020, and $2.80 prior to their last earnings report. The ability to raise its dividend over the last two years is a notable sign of strength that shouldn’t be dismissed.
Price/Book Ratio: there are a lot of ways to measure how much a stock should be worth; but I like to work with a combination of Price/Book and Price/Cash Flow analysis. Together, these measurements provide a long-term, fair value target around $93.50 per share. That suggests that BBY is pretty fairly valued, with 4% upside from their current price and a useful discount price at around $75. It is also worth point out that this same analysis yielded a “fair value” price at around $67 at the end of 2021 and which I take as another sign of generally improving fundamental strength.
Technical Profile
Here’s a look at the stock’s latest technical chart.
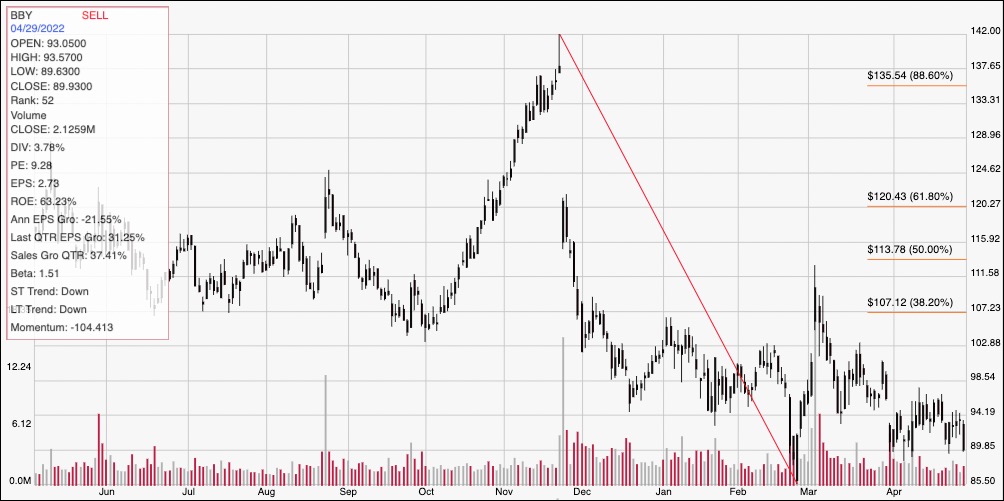
Current Price Action: This chart represents BBY’s price activity over the past year. The red diagonal line traces the stock’s fall from its $142 high in November of last year to its late February low at around $85.50. It also provides the baseline for the Fibonacci retracement lines shown on the right side of the chart. After attempting a failed rally to start marching, the stock faded back towards its March low, and began consolidating in April in range between current support at around $90 and immediate resistance at $95. The stock is roughly in the middle of that range as of this writing. A push above $95 could have short-term upside to about $98.50 based on a lot of pivot activity throughout the past four months in that price region. A drop below $90 should see the stock retest its 52-week low at around $85.50.
Near-term Keys: If you’re looking for a value-based, long-term investment, BBY unfortunately doesn’t fit the bill yet – even with the stock’s drop from that $142 high point and taking their strengthening “fair value” estimate taken into consideration. The stock would need to drop to somewhere around $75 before it can really be considered any kind of realistic bargain, based on current fundamentals and valuation metrics. If you’re looking for a short-term opportunity, however, there are a couple of signal points that could be useful. A push above resistance at $95 could act as a good signal to consider buying the stock or working with call options, with a short-term, momentum-based target price at around $98.50 per share, and additional room to $104 if buying activity increases. If the stock drops below current support at $90, you could also think about shorting the stock or buying put options, with an eye on $85.50 as a quick profit-taking point on a bearish trade.