One of the big challenges for average investors is sifting through the mountains of information that comes from the market on a daily basis. I think that may be the biggest reason that so many investors have learned over the course of decades of market activity to rely on analyst estimates for a company’s future prospects. As both an analyst and an investor, I actually find the idea a little ironic, because predicting the future in any context is nothing more than pure guesswork, and any success comes by nothing but sheer luck – but we still keep trying to do it anyway.
That tendency to rely on future estimates is one of the reasons that, a long time ago I started studying the principles of value-based analysis. That process led me to the writings of Benjamin Graham, who is widely credited as the father of fundamental analysis and well-known as the man who taught a young Warren Buffett the basic principles that still drive his investment philosophy today.
One of the primary takeaways for me was the way that Mr. Graham didn’t use future estimates in his analysis. He preferred to boil his investment decision to a simple question: is the company’s book of business worth more than its stock price today? If the answer was yes, the stock was worth consideration as a long-term investment. The larger the difference between a company’s value and its actual stock price, the more compelling the argument became. Estimates about the future don’t figure into that question, or its answer, at all.
The question of how to determine the value of a company’s book of business has a lot of different possible answers. While Mr. Graham’s original data points for finding that number have become dated, the basic principles he described nearly a hundred years ago still apply, and have become the foundation of the value-based system I use to identify my own investing opportunities, and that are the core of the analysis I write about every day in this space.
Now to the stock I’m using to for today’s post. Xerox Holdings Corporation (XRX) is a company that I have followed for some time, and that I have used to pretty nice effect on a number of occasions over the last few years – even during the pandemic, when the entire Business Services industry this company operates in struggled as practically all of corporate America shifted to remote workforce operations and the services that support them. That working model is still in place for big portions of the business wold. For a business that largely relies on traditional, in-office operations, that means that XRX has been focusing extensively on cost controls to survive the worst, and most persistent pandemic-driven effects in order to survive.
XRX’s earnings reports for most of the past two years have indicated big impacts on their business that continue to be felt even as most parts of the country have begun shifting their COVID focus to endemic-stage treatments. Even so, the extended effect remote work continues to have on the Business Services segment has pushed XRX into a strong downward trend for the past year that hit its latest low in late April at around $16. That followed a temporary attempt to reverse the downward trend that peaked in January and has since seen the stock capitulate to broad market momentum. While there continue to be some concerns, XRX also has some clear elements of fundamental strength. Are they enough to suggest that analysts and the market have overreacted? If so, that should also mean that XRX’s value profile could be even better than it was before. Let’s dive in.
Fundamental and Value Profile
Xerox Corporation is a provider of digital print technology and related solutions. The Company has capabilities in imaging and printing, data analytics, and the development of secure and automated solutions to help customers improve productivity. The Company’s primary offerings span three main areas: Managed Document Services, Workplace Solutions and Graphic Communications. Its Managed Document Services offerings help customers, ranging from small businesses to global enterprises, optimize their printing and related document workflow and business processes. Managed Document Services includes the document outsourcing business, as well as a set of communication and marketing solutions. The Company’s Workplace Solutions and Graphic Communications products and solutions support the work processes of its customers by providing them with printing and communications infrastructure. XRX’s current market cap is about $2.7 billion.
Earnings and Sales Growth: Over the last twelve months, earnings declined more than -154.55%, while sales were about -2.5% lower. In the last quarter, earnings dropped over -135% while revenues were -6% lower. These metrics can be closely tied to the market’s reaction over the last few weeks, and the stock’s fall from grace over that period. XRX’s operating profile has shown a similar effect, as Net Income was -7.86% of Revenues over the last twelve months, and improved to a still-negative -3.36% in the last quarter.
Free Cash Flow: XRX’s free cash flow is healthy, at about $511 million over the last twelve months. While that number decreased from $757 million a year ago; given the severity of the impact the pandemic has had, the decline isn’t too surprising. The current Free Cash Flow number also translates to a useful Free Cash Flow Yield of 18.56%. It is also worth noting that XRX’s Free Cash Flow was $0 in June of 2018, with the company showing consistent improvement in this critical metric from that point until 2020. When XRX can be expected to see its Free Cash Flow regain pre-pandemic levels is an open question that many industry experts aren’t expecting to see answered until sometime in 2023.
Debt to Equity: XRX has a debt/equity ratio of .67. That’s a conservative number that reflects management’s careful approach to debt management. Since the beginning of 2018, the company’s long-term debt has decreased from a little more than $5.2 billion to its current level of $2.8 billion (down from $3.5 billion at the end of 2021). Their balance sheet also shows more than $1.6 billion in cash and liquid assets, which means that servicing their debt isn’t a problem, and for now provides an important buffer, especially since operating profits indicate the company has been spending more than they have brought in.
Dividend: XRX pays a dividend of $1.00 per share, which translates to an annual yield of 5.62% at the stock’s current price.
Price/Book Ratio: there are a lot of ways to measure how much a stock should be worth; but I like to worth with a combination of Price/Book and Price/Cash Flow analysis. Together, these measurements provide a long-term target at about $22.50 per share, suggesting that the stock is undervalued by 29% at its current price. An interesting side note is the fact that XRX has a current Book Value of $28.43 per share – which is about 62% above the stock’s current price.
Technical Profile
Here’s a look at the stock’s latest technical chart.
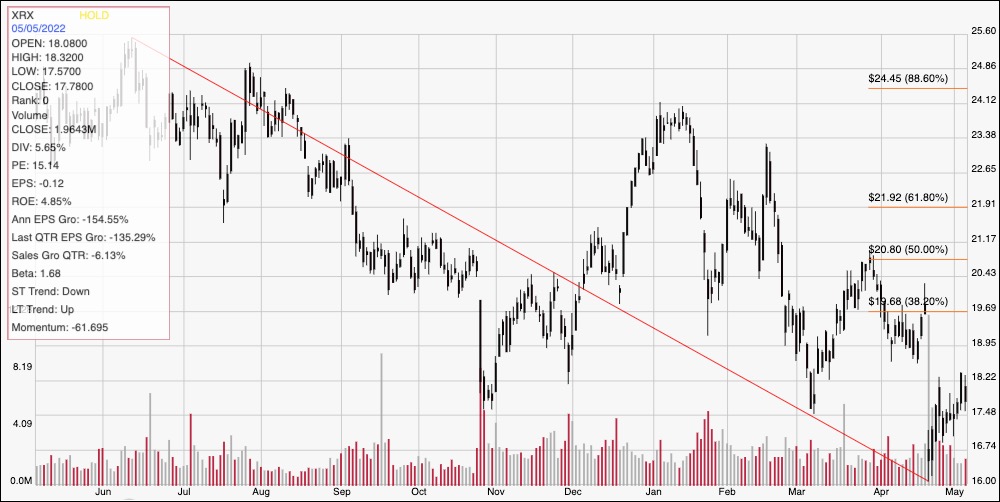
Current Price Action/Trends and Pivots: The diagonal red line traces the stock’s downward trend from its 52-week high at around $27 in March of last year to its October low at around $16. It also provides the baseline for the Fibonacci retracement lines shown on the right side of the chart. Since hitting its latest low at around $16, the stock has rallied to a little below $18. Current support should be at around $17.50 based on pivot lows seen in October 2021 and March of this year, with immediate resistance waiting between $19 and $19.50 where the 38.2% retracement line sits. A push above $19.50 should see upside to about $21, which is the level I’m using as a reference point for a potential bullish trend reversal. I think if the stock can push above $21, it should see upside to between $24 and $25. A drop below $17.50 should retest the stock’s 52-week low at around $16, with additional downside to about $14.50 if that support level doesn’t hold.
Near-term Keys: XRX’s value proposition is very tempting, but I am concerned about the company’s pattern of declining earnings and free cash flow along with negative Net Income. Taking a long-term position in this stock given those declines right now means that you must be willing to accept the possibility of continued downside as the stock can really only be expected to keep following the downward trend that has held its course for the past year. That also means that the best probabilities to work with this stock right now lie in short-term trades. If you prefer to use momentum-driven trading strategies you could consider using a drop below $17.50 to short the stock or buy put options, with a practical target price at around $16 per share. A push above $19 could provide an aggressive signal to think about buying the stock or working with call options, with $21 providing a practical, quick-hit profit target for a bullish trade.