Traditional, growth-oriented investing puts most of its emphasis on stocks that have already started moving up. That makes sense when you consider the popular technical idiom that a “stock tends to follow the direction of its next longer trend.” It means that when you can clearly see a stock going up, it should continue to go up. It’s a forecast that often supports itself, as more and more growth-focused investors recognize the strength of a stock’s trend and start to jump on board themselves. That keeps the momentum going and can extend even long-term trends (9 months to 1 year) into multiyear patterns of growth.
My investing preference runs more than a little counter to the growth-oriented mindset, and is commonly called contrarian investing. Contrarian investing is often correlated in equal fashion with value investing, which is where I think my method actually fits best.
In simplest terms, value investing means looking at a company’s book of business and trying to determine how closely it may be correlated to the stock’s current trading price. If a stock’s price is relatively low in comparison, it usually means the stock is trading at a useful discount. More often than not, that also means that the best set ups will be found at or near historical lows – which is why this approach also requires a “contrarian” mindset. Where most growth-oriented investors tend to dismiss stocks that have been dropping, contrarian, value-focused investors sit up and take notice.
One of the biggest reasons value-focused investors tend to be those with a bit of a contrarian bent is because for most people, a stock that is dropping near to historical lows, or possibly even creating new historical lows is considered radioactive. Listen to most talking heads on TV about stocks that have been moving in long-term downward trends and you’ll rarely hear about what kind of opportunity the stock might provide. They’ll almost always just talk about what a dog the stock has been and start listing all of the reasons average investors should stay away.
As a contrarian, I like hearing this kind of talk, because this is where I have found a competitive advantage in my approach to the markets. When everybody else seems to be discounting a stock just because it has been dropping, a patient, careful investor can find some excellent opportunities to buy good companies at very attractive prices. It’s one of the reasons that Benjamin Graham, the man who mentored a young Warren Buffett about the markets, taught that if a stock can be bought at a deep discount to the value of its business, its current price activity is a very secondary consideration at best.
There is an important caveat that value-based investors have to keep in mind: sometimes a stock falls into a long-term downward trend, or picks up a lot of bearish momentum for very good reasons. Efficient market theory argues that a stock’s fundamentals are always baked into a stock’s current price, with the trends that they form simply being a reflection of the investing public’s understanding of those fundamentals. That’s why you’ll hear pure technicians dismiss the need for fundamental analysis and say that wherever a stock’s current price may be, the market is always right.
As an investor who leans heavily on my contrarian nature and so on the principles of value investing, but who also cut my teeth on the technical side during the early stages of my investing career, I’ve fallen somewhere in the middle of these two opposing extremes. Seeing a stock at or near a historical low piques my interest, and makes me want to start taking a stock seriously as a value-based candidate; but its downward trend also makes me leery that maybe there is more downside to come. So the truth is that I ideally like to see stocks coming off of historical lows, with some positive indications that the trend could be or is about to reverse to the upside.
Newell Brands Inc. (NWL) is an interesting case in point. This is a stock that increased from a low point around $11 in May of 2020 to a peak at around $30 May of 2021, and then dropped back to around $20 in mid-December. The stock has mostly been range-bound since then, moving between support at around $21 and resistance at around $23. This is a company with a large footprint in the Household Durables industry, well-known brands in a portfolio lineup that includes Sharpie and Paper Mate writing utensils, Graco baby products, Rubbermaid, Elmer’s, Mr. Coffee, and much more. The business has been working for most of the last few years to implement a transformation plan that streamline the company’s broad portfolio mix and enable it to focus more effectively on its strengths. The earnings reports of the last year or so suggest had started to positively impact the company’s bottom line. Now that the stock appears stuck around its 52-week low, the question for a value-focused investor like myself is whether NWL’s fundamentals signal those strengths are still in place, and if the stock’s drop has come far enough, to make it a useful point of reference for a value-based opportunity. If not, its current drop within the larger downward trend could be just a sign of still-high downside risk. Let’s see what we can find.
Fundamental and Value Profile
Newell Brands Inc. is a consumer goods company. The Company has a portfolio of brands, including Paper Mate, Sharpie, Dymo, EXPO, Parker, Elmer’s, Coleman, Marmot, Oster, Sunbeam, FoodSaver, Mr. Coffee, Graco, Baby Jogger, NUK, Calphalon, Rubbermaid, Contigo, First Alert and Yankee Candle. The Company operates under three segments: Food and Appliances (comprised of Appliances & Cookware and Food divisions), Home and Outdoor Living (comprised of Home Fragrance, Outdoor & Recreation and Connected Home & Security divisions), and Learning and Development (comprised of Writing and Baby & Parenting divisions). NWL has a current market cap of $9.2 billion.
Earnings and Sales Growth: Over the last twelve months, earnings increased by 20%, while sales increased 4.37%. In the last quarter, earnings dropped by -14.3% while sales were -14.9% lower. The company’s margin profile counters the last quarter’s the negative earnings pattern, which I think is a good indication that the company is being challenged to manage costs amid broad supply chain issues that have been a trailing symptom of pandemic-driven pressures, but that also seem unlikely to change in the near term. Over the last twelve months, Net Income was 6.71% of Revenues, and increased to 9.8% in the last quarter.
Free Cash Flow: NWL has free cash flow of -$342 million over the last twelve months. This number was just $295 million at the beginning of 2019, making Free Cash Flow growth a useful benchmark for the long-term success so far of the company’s transformation plan. The dip to negative territory, contrasted against a decline from $347 million three quarters is a significant concern. Their current Free Cash Flow number translates to a Free Cash Flow Yield of -3.73%.
Debt to Equity: the company’s debt to equity ratio is 1.23, which is a bit high and is reflected in the company’s balance sheet. As of the last quarter, cash and liquid assets were $344 million (down from $981 a little over a year ago) versus a little more than $4.88 billion in long-term debt. It is worth noting that in late 2018, long-term debt was about $9.3 billion, so this number has been declining steadily, which is a net positive.
Dividend: NWL pays an annual dividend of $.92 per share, which translates to a very attractive annual yield of 4.15% at the stock’s current price.
Price/Book Ratio: there are a lot of ways to measure how much a stock should be worth; but I like to work with a combination of Price/Book and Price/Cash Flow analysis. Together, these measurements provide a long-term, fair value target at $8.75 per share. That means that at the stock’s current price, it is overvalued by about -61%, with a practical bargain price at around $6.
Technical Profile
Here’s a look at the stock’s latest technical chart.
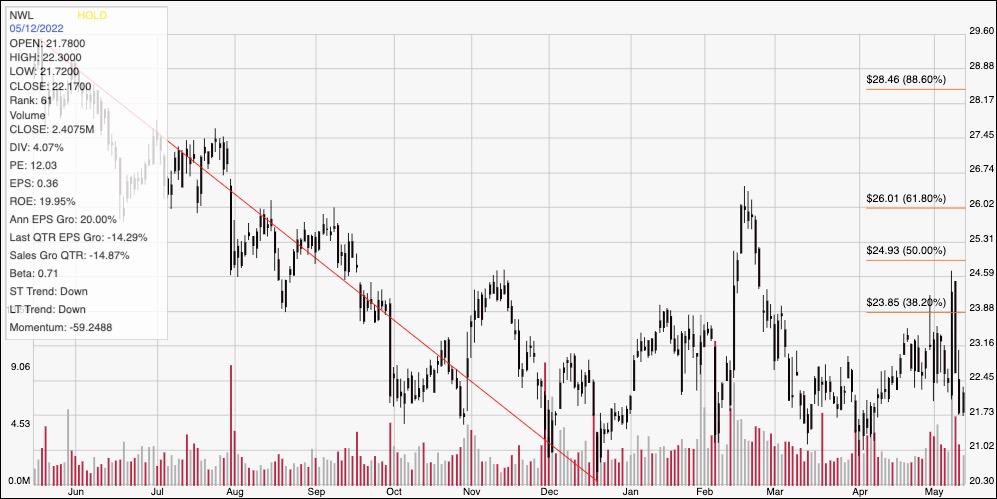
Current Price Action/Trends and Pivots: The chart above displays the stock’s price performance over the last year. The diagonal red line traces the stock’s downward trend from its 52-week high in May of last year at around $30 to its low in December at around $20. It also informs the Fibonacci retracement lines shown on the right hand side of the chart. After rallying to a peak at around $26 in February, the stock has followed the broad market’s sentiment to establish a trading range with current support at around $21 per share, with immediate resistance just below the 38.2% resistance line around $23. A drop below $21 should have limited downside to about $20, at the stock’s 52-week low. A push above $23 could have upside to about $26 at the stock’s February, temporary peak.
Near-term Keys: NWL’s fundamentals are showing some signs of deterioration right now that I think are a reflection of broad economic conditions that include rising input costs. Management indicated in their last earnings report that they expect supply chain constraints and higher costs to persist, possibly into the next year, suggesting that the warning signs my analysis has revealed aren’t likely to be resolved soon. That is a good reason to wait, either for the stock to drop to a more practical discount price, or for indications that the company’s fundamentals – Net Income, Free Cash Flow, and Cash, primarily – have all started to improve before using NWL as a practical, new long-term buying opportunity. If you prefer to work with short-term trading strategies, a push above resistance at around $23 could offer a useful opportunity to buy the stock or work with call options, using $26 as a quick-hit profit target. A drop below $21 could be a signal to consider shorting the stock or buying put options, so long as you intend to work with quick exits. Use $20 as a practical profit target on a bearish trade.