2022 has meant a lot of uncertainty in the marketplace so far. Inflation, rising interest rates and war are just the biggest headlines that have kept the markets on edge, and that seem likely to keep uncertainty relatively high as we start to move into summer. While everybody wants to keep the good times rolling and see long-term market rallies keep rallying, the reality is that economies ebb and flow through cycles of prosperity to scarcity and back again. Cyclicality also sees its way into the stock market, as stock prices follow their own ebb and flow. Those whose peaks and valleys tend to coincide with broad economic conditions are known as cyclical stocks.
Cyclical stocks are those that are expected to do well when economic conditions are generally healthy, and that will naturally struggle when the economy struggles.
One of the core sectors of the economy that fits this very generalized description is the Transportation sector, which takes in a broad set of industries, including airlines, railroads, trucking and freight, overseas shipping, and so on. One of the major contributors to rising costs throughout the economy have been constraints on the supply chain, along with rising fuel prices. These are dynamics that generally work against stocks in the Transportation industry.
Uncertainty and volatility amid signs that the economy is struggling means that you can often find stocks in these industries trading at pretty significant discounts to their not-so-distant highs. That makes them tempting fodder for a contrarian, value-oriented investor. I like to pay attention to these stocks, because their fundamentals can give me some useful clues about their ability to weather an economic downturn. These are also stocks that, like any other, can see big swings from high to low based on nothing more than the market’s expectation for what the economy might do in the near future.
CSX Corporation (CSX) is a good example of the kind of stock I’m referring to. As one of the four largest transportation companies in the oligopoly that is the U.S. Road & Rail industry, this is a stock that is very sensitive to a variety of economic dynamics, from commodity and fuel prices to interest rate fluctuations. The collapse of oil prices during the pandemic might have been taken as a good thing for this sector, since fuel costs should generally be lower; but as economy activity ground to a halt during the second quarter of 2020, so too did the demand for transportation services.
From a bear market bottom in March of 2020, the stock rebounded like most of the rest of the market as investors acted on the hope that the net economic effect would be temporary; in fact, the stock used the market’s broad, forward-looking and bullish hope of a recovery as a reason to push the stock from around $22 in July 2020 to a peak in early May of 2021 at around $35. From that point, the stock dropped back to a short-term low at around $30 in late September. Since then, the stock picked up a lot of bullish momentum, peaking at the start of January at around $38, but has picked up a new wave of bearish momentum that now has the stock sitting at around $31.
Cyclical stocks like CSX are sensitive to the kind of pressures and dynamics I’ve just outlined, which is why it becomes important to take a critical look at the company’s balance sheet and overall fundamental strength. This is a company with a strong fundamental profile, and a balance sheet that has weathered the pandemic storm remarkably well and appears well positioned now. That is a positive sign that bodes well for the company in the long-term, but another question we have to answer is whether the stock’s current trading price represents a compelling enough value under current market conditions to justify taking its long-term opportunity seriously. Let’s dive in.
Fundamental and Value Profile
CSX Corporation is a transportation company. The Company provides rail-based freight transportation services, including traditional rail service and transport of intermodal containers and trailers, as well as other transportation services, such as rail-to-truck transfers and bulk commodity operations. The Company categorizes its products into three primary lines of business: merchandise, intermodal and coal. The Company’s intermodal business links customers to railroads through trucks and terminals. The Company’s merchandise business consists of shipments in markets, such as agricultural and food products, fertilizers, chemicals, automotive, metals and equipment, minerals and forest products. The Company’s coal business transports domestic coal, coke and iron ore to electricity-generating power plants, steel manufacturers and industrial plants, as well as export coal to deep-water port facilities. CSX has a current market cap of $69.2 billion.
Earnings and Sales Growth: Over the last twelve months, earnings increased a little more than 26%, while sales increased 21.33%. In the last quarter, earnings declined by -7.14% while sales were flat, but negative by -0.41%. CSX operates with a healthy, robust margin profile that has been remarkably resilient, but also matches its current declining earnings pattern; in the last twelve months, Net Income was almost 30% of Revenues, but weakened to 25.17% in the last quarter.
Free Cash Flow: CSX’ Free Cash Flow is healthy and growing, at almost $3.9 billion. That marks an improvement from $3.8 billion in the quarter prior, and about $3.1 billion a year ago. Their current Free Cash Flow number translates to a Free Cash Flow Yield of 5.78%.
Debt to Equity: CSX has a debt/equity ratio of 1.21. This indicates the company is highly leveraged; but this is also very typical of stocks in the Transportation industry. Their balance sheet shows they have a little more than $2.3 billion in cash and liquid assets against roughly $16 billion in long-term debt as of the most recent quarter. The company’s operating profile suggests there should be no problem servicing the debt they carry.
Dividend: CSX pays an annual dividend of $.40 per share, which at its current price translates to a dividend yield of about 1.28%. Their dividend payout ratio is also conservative, at less than 25% of their earnings over the last year.
Price/Book Ratio: there are a lot of ways to measure how much a stock should be worth; but I like to work with a combination of Price/Book and Price/Cash Flow analysis. Together, these measurements provide a long-term, fair value target around $33 per share. That means the stock is somewhat overvalued at its current price, with 6% upside from its current price, and with a useful bargain price at around $26.50.
Technical Profile
Here’s a look at the stock’s latest technical chart.
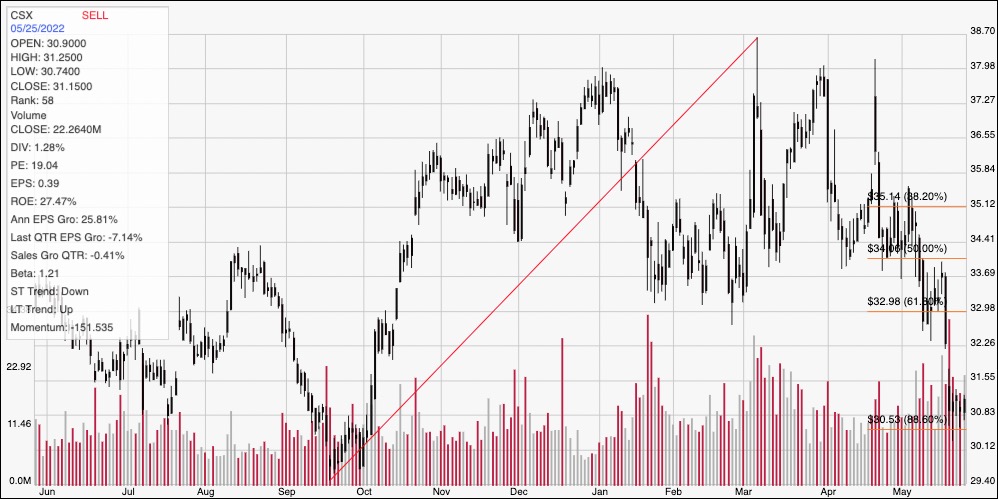
Current Price Action/Trends and Pivots: The chart above displays the past year of price activity for CSX. The red diagonal line traces the stock’s upward trend from its September 2021 low at around $29.50 to its peak at the start of March at around $39. It also provides the baseline for the Fibonacci retracement levels outlined on the right side of the chart. The stock has picked up a lot of bearish momentum since the beginning of May, falling below all of its major retracement lines, but appears to be finding new, current support at around $30.50 where the 88.8% retracement line sits. Current resistance is around the 61.8% retracement line, which is right at $33. A drop below $30.50 should retest the stock’s yearly low at around $29.50, but could fall to about $27.50 based on the distance between current support and immediate resistance. A push above $33 would be the minimum to signal a potential trend reversal, with upside to about $35 where the 38.2% retracement line sits.
Near-term Keys: From a long-term perspective, it’s hard to see a lot of long-term upside in CSX, despite its strong fundamental profile. While Free Cash Flow is increasing, I also consider the company’s decline in earnings and Net Income as a red flag that bears watching – especially since the negative pattern has held for the last two quarters. Based on the fair value analysis I described earlier, the stock wouldn’t offer a compelling value-based price unless it drops to around $26.50 per share – which is about -14% below the stock’s current price. That means the best opportunities to work with the stock are with short-term, momentum-oriented trades. A push above $33 could offer a signal to consider buying the stock or working with call options, with a useful target price at around $35. A drop below $30.50 as a signal to consider shorting the stock or buying put options, with a practical, quick exit target at around $29.50, and $27.50 possible if selling momentum accelerates.