Among the interesting trends I have been watching for most of the last two and a half years, and that has emerged over that period is the shift in consumer focus towards health, wellness and fitness. That includes the clothes we wear for those activities.
For most of us, exercise usually means going to the gym where we can find all of the equipment needed to pick and choose what to do in any given day. Based on my own personal observation in my own little corner of the world, that seems to mean that even as economy activity has increased, and community gyms are once again picking up capacity, people are also working out at home, and going outside to run, walk or ride. Some of this shift is being seen in the sales numbers over the last few months for many apparel and shoe manufacturers, and even in sales at retailers, including big-box stores and specialty shops like Foot Locker (FL).
That doesn’t mean that these businesses are out of the woods; foot traffic at most brick-and-mortar stores and malls, which has also been challenged by an increasing emphasis on e-commerce and direct-to consumer initiatives that started to gain momentum in 2019, generally remains significantly below pre-pandemic levels, which has put a lot of emphasis on these companies’ ability to rely on omnichannel marketing and distribution systems.
E-commerce has been one of a few different headwinds FL has been dealing with for a few years and has been lagging its competitors and even its suppliers. That includes big names like Nike Inc. (NKE) who are publicly working to drive direct-to-consumer relationships over traditional retail partners. FL’s specific reliance on NKE to stock its inventory has been signaled as a risk element, and for some have overshadowed FL’s intense capital investments in its own omnichannel marketing, sales and delivery that finally began to show positive growth in e-commerce in 2021, while management also put a lot of effort (and investment) into leveraging inventory management systems and supply chain management to increase productivity and efficiency.
While many of FL’s difficulties – decreasing mall foot traffic, supplier investments in competing, direct-to-consumer marketing channels in particular – have become, and are expected to continue to be long-term in nature, management’s efforts to develop their own omnichannel marketing programme and improve inventory and supply chain systems have helped FL improve a very solid fundamental profile consistently throughout most of the past two and half years and build a fortress-level balance sheet. The stock itself more than doubled in value from 2020 to 2021, driving from around $31 in October 2020 to a peak in May 2021 at nearly $67. Since then, the stock has dropped into a downward trend that really picked up momentum after the company’s March earnings report. Immediate market reactions to earnings are often exaggerated by investor perceptions of management comments about future prospects or expectations, and rising inflation rates to curb an accelerating economy aren’t expected help a company like FL. That begs the question of whether this latest extension of stock’s long-term, downward trend is another overreaction that contradicts the company’s fundamental strength? If so, the stock could be offering an even better value proposition than it has in the past. Let’s dive in.
Fundamental and Value Profile
Foot Locker, Inc. is a retailer of shoes and apparel. The Company operates through two segments: Athletic Stores and Direct-to-Customers. The Company is an athletic footwear and apparel retailer, which include businesses, such as include Foot Locker, Kids Foot Locker, Lady Foot Locker, Champs Sports, Footaction, Runners Point, Sidestep and SIX:02. The Direct-to-Customers segment is multi-branded and sells directly to customers through Internet and mobile sites and catalogs. The Direct-to-Customers segment operates the Websites for eastbay.com, final-score.com, eastbayteamsales.com and sp24.com. Additionally, this segment includes the Websites, both desktop and mobile, aligned with the brand names of its store banners (footlocker.com, ladyfootlocker.com, six02.com kidsfootlocker.com, champssports.com, footaction.com, footlocker.ca, footlocker.eu, runnerspoint.com and sidestep-shoes.com). FL has a current market cap of about $2.7 billion.
Earnings and Sales Growth: Over the last twelve months, earnings declined by -18.37%, while revenues increased by about 1%. In the last quarter, earnings were -4.2% lower, while sales slipped -7.1% lower. The company’s margin profile had been showing impressive improvement through most of 2021, but has weakened as of the latest report; Net Income as a percentage of Revenues over the last twelve months was 9.18%, and declined to 6.11% in the last quarter. While many analysts dismiss FL (primarily due to its reliance on traditional stores, mall traffic, and NKE, I think the consistent improvement in its Net Income pattern under difficult conditions through most of 2020 and 2021 provided strong confirmation that the company’s investments in digital channels and improved internal systems are bearing fruit. This quarter’s decline – on the back of a similar pattern in the quarter prior – appears to be attributable to supply chain shortages and challenges that have persisted as a plague to multiple sectors and industries throughout the pandemic and have been exacerbated this year on multiple fronts. Whether that is a cyclical or chronic condition, however can only be determined by continuing to watch the company’s progress in the quarters ahead.
Free Cash Flow: FL’s free cash flow is healthy, at $457 billion over the last twelve months and which translates to a Free Cash Flow Yield of 16.24%. This number has declined over the past year, from about $701 million, and is about level with the prior quarter, which came in at around $464 million.
Debt to Equity: FL’s debt/equity ratio is .14, which is very low and marks a conservative approach to leverage. The balance sheet shows $450 million in long-term debt in the last quarter, which is significantly below the more than $2.8 billion they reported for the last quarter of 2019. Cash and liquid assets are healthy, at about $551 billion, but significantly below the $1.34 level they reported at the end of 2021. Debt is manageable, but the decline in liquidity, along with Free Cash Flow are concerns that shouldn’t be dismissed.
Dividend: FL’s annual divided was $.60 per share at the end of 2020, but was increased to $.80 per share in early 2021, $1.20 at the end of the third quarter, and $1.60 early this year. That translates to a yield of 5.37% at the stock’s current price. It is worth noting that FL cut their dividend at the beginning of the pandemic from $1.52 per share in an effort to help preserve cash and boost their balance sheet; but the fact they continued to pay a dividend where many companies chose to eliminate it altogether, along with the recent increases is also a sign of strength. It should also be noted that they have also instituted massive stock buyback program as a second leg of management’s effort to return value to their shareholders. Both the buyback and the dividend increases are significant signals of management’s confidence in their path ahead, and can offer a partial (but not a complete) counter to questions about declines in cash and free cash flow.
Price/Book Ratio: there are a lot of ways to measure how much a stock should be worth; but I like to worth with a combination of Price/Book and Price/Cash Flow analysis. Together, these measurements provide a long-term target at about $48 per share. That suggests that the stock is undervalued by about 62% right now. It should be noted that after the third quarter of 2021, this same analysis yielded a long-term target price at around $63 per share, and $53.50 per share in the first quarter of this year.
Technical Profile
Here’s a look at the stock’s latest technical chart.
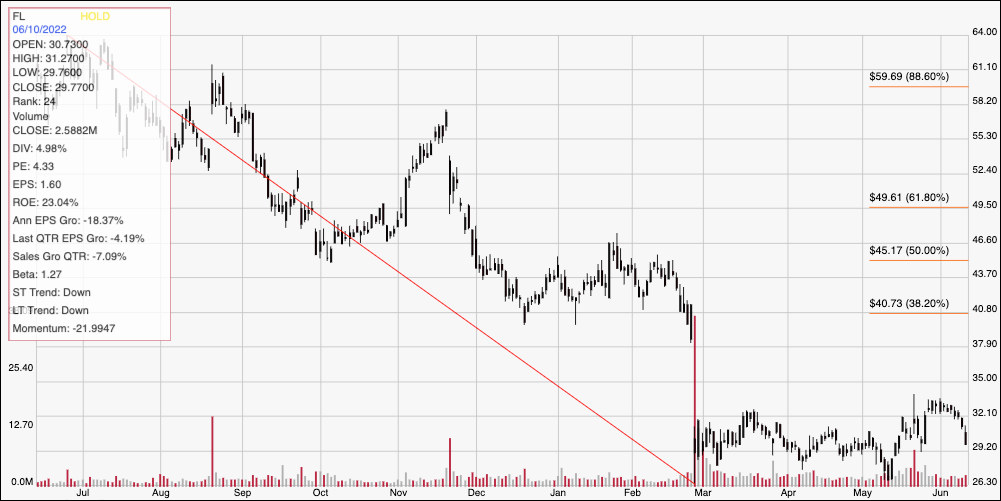
Current Price Action/Trends and Pivots: The chart above displays FL’s price performance over the last year. The diagonal red line traces the stock’s decline from its June 2021 peak at around $64 to its 52-week low at around $26; it also serves as the baseline for the Fibonacci retracement lines on the right side of the chart. After falling to its yearly low overnight in late February, the stock settled into a consolidation pattern between $32 and $26 through May. The stock appeared to break out of that pattern in the last week of May, but broad market momentum has pushed the stock back down into that range. Current support is around $28, with immediate resistance at about $32. A push above $32 could see upside to fill about half of the stock’s February gap, which I put at about $35 before finding next resistance. A drop below $28 should retest the stock’s yearly low at around $26, with additional downside to about $24 if that level is broken.
Near-term Keys: FL’s current bearish momentum stabilized, based on the consolidation pattern that held through most of last month, but it could be picking up fresh momentum after the latest rally failed to hold above that range. That suggests the stock could still have a fair amount of downside left if the market continues to be volatile and current conditions remain broadly bearish. I’m also concerned about the pattern of decline in Free Cash Flow and Cash, of FL’s fundamentals and should rightly be considered as risk elements that I think counter the stock’s very tempting value proposition. If you prefer to focus on short-term trading strategies, you could use a break above $32 as a signal to consider buying the stock or working with call options, using $35 as a practical profit target. if the stock drops below $28, you could consider shorting the stock or buying put options, with $26 offering a useful, quick-hit profit target on a bearish trade.