Markets are naturally cyclical – they swing from high to low and back again on a consistent, if unpredictable basis over a range of time frames. The different time periods associated with any given cycle, or sometimes even the depth of a certain cycle’s direction, can shade the casual investor’s perception about a stock’s opportunity.
The most recent major bull market, which extended itself over a more than ten-year time period, was only briefly interrupted by the global pandemic, and appears to have finally found its bear market end this year, is a good example. Because of both the unprecedented time period that market’s bullish run covered, and even more particularly the abnormally-extended rallies that typified the market’s bullish momentum during its last couple of years, a lot of average investors made the mistake of assuming that the market would simply continue that run.
Technically speaking, that bull market ended in February 2020, as COVID-19 made its way to North American shores and prompted not just national, but global shutdowns that shuttered entire industries for an extended period of time. The irony of the story is that while the market reacted equally as violently – every major market index plunged by about -20% in less than a month – the recovery only took slightly longer, recovering pre-pandemic highs by late spring of last year and prompting some analysts and economist to predict the good times would continue into 2022 and 2023.
What a difference a few months makes! Rising energy prices at the end of 2021, along with extended supply issues that started before 2020 were made even worse by Russia’s war with Ukraine, with all the geopolitical and economic fallout that typically accompanies war. This week the Fed raised interest rates to combat accelerating inflation for the third time this year, with all indications showing another increase is likely in July. War along with rising inflation and interest rates on the heels of a pandemic that still isn’t over no matter how much we don’t hear about it now – it’s no wonder, really that market has dropped into new bear market levels since the beginning of May, with bearish momentum accelerating even more in the last couple of weeks.
For a somewhat contrarian-minded investor like me, the conditions I’ve just described mean that it’s one thing to be open to good buying opportunities right now – but it is still smart to think in very careful, selective terms about taking on new positions. For the stock market, that means not simply taking a stock’s price action – up or down – at face value without first diving into the company’s fundamentals to get a sense of what is driving current price activity. It is also a good idea to take a step back from typical metrics and think about other factors that may work in a company’s favor in the foreseeable future, or that may represent elements of risk.
Oshkosh Corporation (OSK) is a good example of what I mean. From November of 2020 to May of 2021, the stock more than doubled in price, rising quickly from around $67 to a peak at nearly $138 per share. From that point, the stock has fallen back into a long-term downward trend that has the stock pushing to a new 52-week low at around $81, and about -35% below its most recent peak in mid-January at around $124.50 per share. Their generally solid fundamental profile does show a few holes that I think have played a role in the market’s treatment of the stock over the past ten months.
Trying to take a look at the broader picture for OSK means factoring in not only where their business has been, but also where it’s going. Long established as a primary manufacturer of telehandlers, aerial work platforms, and specialty trucks for the defense, fire and emergency, concrete placements, and refuse hauling markets, OSK has signaled a strong commitment to EV product development. Their Pierce Volterra Pumper, for example, is the first electric fire truck in service in North America, with additional EV platforms in place in concrete placement, and scissor lifts. In February 2020, the company made headlines when the United States Postal Service (USPS) selected OSK to deliver 50,000 to 165,000 EV and hybrid vehicles over the next ten years in a nationwide, sustainable upgrade of the USPS fleet. More recently, the company announced an additional, $2B+ order from USPS for the same vehicles.
All of this information makes for an interesting mix for a growth-oriented investor; are these elements also enough to make the stock actually work as a legitimate value-driven, long-term opportunity? Let’s dive in to the details and see if we can decide.
Fundamental and Value Profile
Oshkosh Corporation (OSK) is a designer, manufacturer and marketer of a range of specialty vehicles and vehicle bodies, including access equipment, defense trucks and trailers, fire and emergency vehicles, concrete mixers and refuse collection vehicles. The Company’s segments include Access Equipment; Defense; Fire & Emergency, and Commercial. The Access Equipment segment consists of the operations of JLG Industries, Inc. (JLG) and JerrDan Corporation (JerrDan). The Defense segment consists of the operations of Oshkosh Defense, LLC (Oshkosh Defense). The Fire & Emergency segment consists of the operations of Pierce Manufacturing Inc. (Pierce), Oshkosh Airport Products, LLC (Airport Products) and Kewaunee Fabrications LLC (Kewaunee). The Commercial segment includes the operations of Concrete Equipment Company, Inc. (CON-E-CO), London Machinery Inc. (London), Iowa Mold Tooling Co., Inc. (IMT) and Oshkosh Commercial Products, LLC (Oshkosh Commercial). OSK has a current market cap of about $5.4 billion.
Earnings and Sales Growth: Over the last twelve months, earnings declined by about -84%, while revenues rose 3%. In the last quarter, earnings improved by more than 167%, while sales were 8.6% higher. The company’s operating margin has survived the difficulties of the past two years better than most in the industry, but hasn’t been immune to the challenges that persist; over the last twelve months, Net Income as a percentage of Revenues was 3.84% and weakened sharply in the last quarter to -0.11%.
Free Cash Flow: OSK’s free cash flow is healthy, at about $1.06 billion over the past year. This number marks a decline from the last quarter, which was $1.1 billion. The current number also translates to a Free Cash Flow Yield of 6.95%. I don’t take the company’s Free Cash Flow pattern, which is mostly stable as a complete offset of the warning flag raised by the deteriorating Net Income and negative Earnings pattern, but it does suggest that the company is still sitting on solid operating ground despite those challenges.
Debt to Equity: GRMN has a debt/equity ratio of .20, implying a conservative approach to leverage and debt management. GRMN also has $945 million in cash and liquid assets (down from about $1.3 billion in the quarter prior) versus $594 million in long-term debt. Servicing their debt isn’t a problem – but the current earnings and net income patterns could challenge that stability if they aren’t corrected in the quarters ahead.
Dividend: OSK’s annual divided is $1.48 per share, which translates to a yield of about 1.82% at the stock’s current price. It also marks an increase from $.96 per share, per annum around the middle of 2018, $1.20 per share in 2020 and $1.32 per share in 2021. An increasing dividend is a strong sign of management’s confidence in its business plan and operating model. Even with the increase, it is also worth noting that OSK maintains a conservative payout ratio; the current annualized dividend is less than 25% of the company’s total earnings per share over the last twelve months.
Price/Book Ratio: there are a lot of ways to measure how much a stock should be worth; but I like to work with a combination of Price/Book and Price/Cash Flow analysis. Together, these measurements provide a long-term, fair value target at about $107 per share. That suggests the stock is trading at a tempting discount, with 31% upside from the stock’s current price. It’s also worth noting that in the last quarter, this same analysis yielded a long-term, fair value target at around $132.
Technical Profile
Here’s a look at the stock’s latest technical chart.
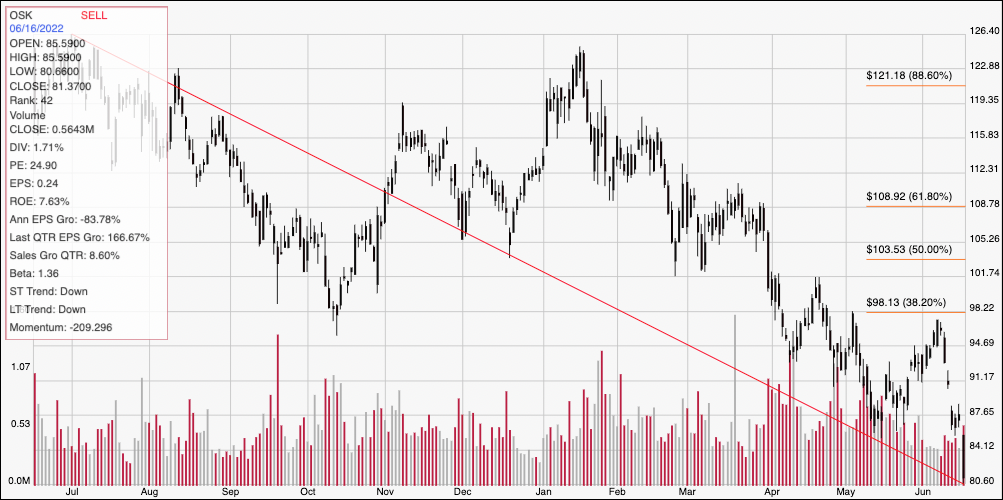
Current Price Action/Trends and Pivots: The red diagonal line measures the length of the stock’s downward trend from its June 2021 peak at around $126.50 to its recent 52-week low at around $80.60; it also informs the Fibonacci trend retracement lines shown on the right side of the chart. The stock has broken below last support at around $86 to mark immediate resistance at that level, establishing a new 52-week low yesterday. Considering the pace of bearish momentum, expected current support is hard to predict, but the distance between the the stock’s May pivot low at around $87 and its peak this month at around $98 could signal next support for the stock should be at around $77. If the stock can reverse its current momentum and push above $86, it should rally to test that last peak at around $98, and right around the 38.2% retracement line. For now, the stock looks more likely to keep falling.
Near-term Keys: OSK’s value proposition might seem tempting right now, but I think the stock’s current, accelerating bearish momentum along with the red flags shown and the company’s balance sheet are strong reasons to hold off on using this stock as a legitimate value opportunity right now. If you prefer short-term trading strategies, a break above $86 could act as a signal to consider buying the stock or working with call options, using $98 as a useful, short-term profit target. If you want to bet on the stock’s current momentum, shorting the stock or buying put options right now has about $3.50 of downside opportunity to expected support in the $77 price area.