Through the end of April, the Materials sector defied an uncertain market and economic picture in 2022. What a difference a couple of months makes!
As measured by the S&P 500 Materials Sector SPDR (XLB), the sector finally surrendered to the broadly bearish conditions of the rest of the market to drop from a peak at around $91 in late April to a low last week below $73. That’s a -20% drop for the sector that pushes it, with a lot of other sectors, into its own bear market. It’s no surprise, then that even the biggest names in the industry, like Dow Inc. (DOW) have fallen even more sharply over the same period.
Big drops in price, over a short period of time, are hard to take for stocks in which you may have an open position, even if you are working with a value-based perspective that tells you the stock’s long-term opportunity remains above your purchase price. It’s a fine balance every investor has to find for themselves, understanding when to hang on and let the market, and the stock, work its way through its inevitable ebbs and flows, and when call a duck, a duck and simply move on.
The flip side of seeing stocks falling quickly to or near historical lows is that it also opens the door to more and more opportunity. This is one of the reasons I like to put so much emphasis not only on a stock’s valuation but also on its fundamental strength. The market’s momentum can and will effect every stock at some point, no matter what my fundamental and value metrics may say about what a stock’s price could be; but if the drop is coming only from market momentum while the fundamentals remain in place, the value proposition gets even better. Eventually, the market is going to recognize the discount as well, and when it does it will push the stock back up again. The folks that will be best-positioned to take advantage of that bullish reversal won’t be the ones that tried to time the reversal, but those that recognized the value proposition during the drop and weren’t afraid to start buying while it was there.
The Materials sector is made up of industries, and companies that transform raw materials and chemicals into the components and goods that other industries use to create and produce the finished products that businesses and consumers use, which is why I really like this industry as a barometer for broad economic conditions. That certainly doesn’t make them immune from economic cycles and downturns, but it does mean that many of these companies produce goods that are needed and continue to see demand even during difficult economic times. Their exposure to the variability of costs in raw materials and commodities also forces most of them to consider ways they can minimize and manage those variances on a long-term basis. I think the intelligence many of these management teams have about how to run their business in every economic condition also means that there are useful opportunities that can be found in this sector right now if you’re willing to take the time to dig into them.
That brings me to today’s highlight. Dow Inc. (DOW) is a stock that has only been traded publicly since early 2019, but is also a company with a long history behind it. Spun off into its own public entity from DowDupont, its primary subsidiary, Dow Chemical, is one of the three largest chemical producers on the planet. When DOW was spun off of DowDupont, the new company was immediately added to the Dow Jones Industrial Average. Even with the difficulties that have been associated with the conditions of the past two and a half years, this is a company that has leveraged its position as a market leader and economies of scale to manage raw materials cost risks that many expect to extend through this year. They also boast healthy free cash flow, stable operating margins, a generally solid balance sheet, and a very attractive dividend. Since the end of April, this stock has followed the sector, and the broad market more than -27% lower. Before the drop, my analysis on this stock showed a useful value-based opportunity existed at much higher prices than the stock is at today. With solid fundamentals still in place, the stock’s big drop really makes the value proposition even better today. Let’s dive in to the numbers.
Fundamental and Value Profile
Dow Inc. is a holding company for The Dow Chemical Company and its subsidiaries (TDCC). The Company’s portfolio of plastics, industrial intermediates, coatings and silicones businesses delivers a range of science-based products and solutions for its customers in various market segments, such as packaging, infrastructure, mobility and consumer care. The Company’s portfolio is comprised of six global business units, which are organized into three operating segments: Packaging & Specialty Plastics, Industrial Intermediates & Infrastructure and Performance Materials & Coatings. Packaging & Specialty Plastics consists of two global businesses: Hydrocarbons & Energy and Packaging and Specialty Plastics. Industrial Intermediates & Infrastructure consists of two customer-centric businesses: Industrial Solutions and Polyurethanes & Construction Chemicals. Performance Materials & Coatings includes two global businesses: Coatings & Performance Monomers and Consumer Solutions. DOW has a current market cap of about $38 billion.
Earnings and Sales Growth: Over the last twelve months, earnings increased by 72%, while revenues grew about 28.5%. In the last quarter, earnings were 8.84% higher, while sales increased by 6.27%. The company’s margin profile is stable, but weakening slightly, with Net Income that was 11.81% of Revenues over the last twelve months, and 12.0910.28% in the last quarter.
Free Cash Flow: DOW’s free cash flow is very healthy, and strengthening. It was $6.62 billion in the last quarter versus a little over $4.8 billion in the quarter prior. It also marks a useful increase over the past year, when free cash flow was also about $4.8 billion. The current number also translates to an attractive Free Cash Flow Yield of 17.42%.
Debt to Equity: DOW’s debt/equity ratio is .73. This is generally a low number that indicates management takes a conservative approach to leverage. Their balance sheet shows $3.1 billion in cash and liquid asset (down from $3.5 billion about a year ago, but above the $2.9 billion mark that held for the two quarter prior to this one) versus about $14.1 billion in long-term debt.
Dividend: DOW’s annual divided is $2.80 per share, which translates to a yield of 5.36% at the stock’s current price. It is worth noting that the company’s dividend has been consistent at this level since its spinoff from DowDupont, and did not change in 2020 when many companies throughout the marketplace were slashing or eliminating their dividends altogether.
Price/Book Ratio: there are a lot of ways to measure how much a stock should be worth; but I like to worth with a combination of Price/Book and Price/Cash Flow analysis. The fact that this company has existed as a publicly traded entity for less than three years provides a limited historical sample to work with, so I have also incorporated the company’s PEG ratio, which adds estimates for the company’s future growth to the mix. All together, these measurements provide a long-term target at about $76.50 per share. That suggests that the stock’s latest drop has made the stock even more attractive than it was a couple of months ago, with a 47% discount from its current price.
Technical Profile
Here’s a look at the stock’s latest technical chart.
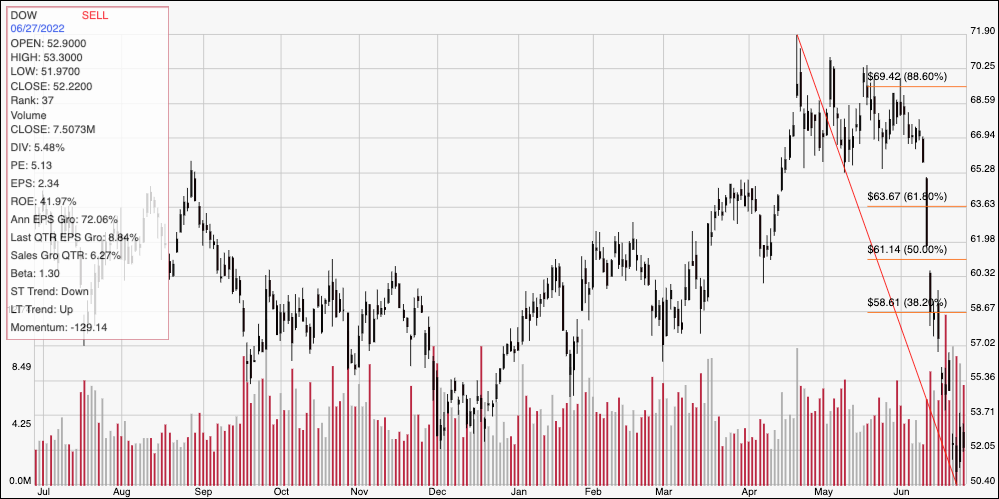
Current Price Action/Trends and Pivots: The red diagonal line traces the stock’s downward trend from its high in April at around $72 to its low, reached last week at around $50.50. It also provides the baseline for the Fibonacci retracement lines shown on the right side of the chart. The drop is sharp, with multiple, overnight gaps along the way that suggest the stock’s bearish momentum may not be done yet. That said, the stock has been showing some resilience since that low, marking current support at $50.50 and immediate resistance at about $55. A drop below $50.50 could see the stock fall to about $46 before finding next support, based on the current distance between support and resistance, while a push above $55 should see next resistance at around $58.50 where the 38.2% retracement line sits. The stock would need to break above $58.50 to mark a reversal of its current, bearish momentum strong to begin a new upward trend.
Near-term Keys: I think DOW’s fundamental profile in the face of the past two-and-a-half year’s worth of pandemic-induced economic conditions is a very interesting story, with a compelling value proposition to boot. The stock’s currently, strong bearish momentum may make a bullish trade, even in the long-term, look a little foolish, but that fact is that the company’s fundamentals have remained strong even as the broad economy and market is showing signs of weakness, which is why I think the value proposition is too good to pass up. If you prefer to work with short-term trading strategies, a push above $55 could be a good signal to think about buying the stock or working with call options, with a useful price target at around $58.50. A drop below $50.50 would be a strong signal to consider shorting the stock or buying put options, using $46 as a quick initial profit target on a bearish trade.