More than two decades of experience as an investor and market analyst have taught me that while the market is very resilient in the long-term, there is one word that always seems to automatically put the market on edge: change.
The COVID-19 pandemic is a good example of what I mean. After a decade of practically uninterrupted growth, the global spread of coronavirus put the entire world into lockdown mode, shuttering economic activity and plunging the stock market into immediate bear market conditions. From a March 2020 low, the market rebounded relatively quickly as economic activity gradually resumed, and by the end of last year most economic experts were wondering how long this newest bullish rally would continue.
2022 shifted the narrative yet again, since extended supply chain issues, combined with increasing consumer demand, with the Russia-Ukraine war thrown in for a little extra combustible fuel have forced the Fed to raise interest rates on an increasingly aggressive basis. If the market abhors change, it fears increasing interest rates, which explains the market’s plunge to bear market conditions this year.
The reality of inflation is that it is an ever-present dynamic with which any and all economies have to contend. The real concern for any market-based economy is tied to the ebb and flow of inflationary pressures. Lack of inflation implies that costs are being driven down, which sounds good at first blush, but which in an extended, extreme state points to declines in demand that usually signal bigger problems such as those we all had to deal with in early 2020. Flip the coin, and increasing inflation does suggest that costs are increasing, which is a concern, but also to rising demand from businesses and consumers that we all generally take as indicative of a healthy, growing economy. The concern is that when inflation has been extended to extreme highs, there are larger issues that prevent suppliers from effectively meeting demand.
Accelerating inflation this year has forced the Fed to raise interest rates three times this year, with each rise also coming in increasing increments – .25%, .5%, and in June at .75%. The acceleration of both frequency and size has been forced by inflationary indicators not seen since the early 1980’s. Those indications have raised concerns that the Fed may be too far behind the curve to catch up and bring the economy back to sustainable rate of growth, even if, as some experts predict, the Fed raises rates next week by 1%. The fear now, and that many economists are starting to predict, is that monetary policy will push the U.S. into a fresh, new, and extended recession.
One of the areas that has been seeing a strong reaction to these indications of cost inflation is in the Food Products industry – an industry that I usually like to think of as a good way to position a portfolio with conservative, even defensive options to help moderate risk. One specific area that seems to be showing unexpected inflationary conditions is in the cost of goods companies in this industry have been seeing for most of the last two years, with no near-term relief in sight. Conagra Brands, Inc. (CAG) is an example. Management has cited cost increases to explain pressures on its business that have hampered liquidity and increased long-term debt, and which they also used at the beginning of the year to decrease their own estimates for the company’s financial performance in 2022. That news prompted investors to start dumping shares. From a peak at around $39 in early June 2021, the stock dropped to a low in December 2021 at around $30.50. The stock has been volatile since then, peaking in April at around $36.50, and falling back to a little below $32 in June, then to another peak at the start of this month around $35 and back again to its current price at around $33. Do the company’s fundamentals suggest they continue to struggle with rising costs and other issues, or are they positioned to turn the corner and offer a conservative investors a useful, defensively positioned investing opportunity at a good value price at a time when low-risk ways to keep your money working for you can be hard to find? Let’s dive in and find out.
Fundamental and Value Profile
Conagra Brands, Inc., formerly ConAgra Foods, Inc., operates as a packaged food company. The Company operates through two segments: Consumer Foods and Commercial Foods. The Company sells branded and customized food products, as well as commercially branded foods. It also supplies vegetable, spice and grain products to a range of restaurants, foodservice operators and commercial customers. Conagra Foodservice offers products to restaurants, retailers, commercial customers and other foodservice suppliers. The Company also operates in the countries outside the United States, such as Canada and Mexico. The Company’s brands include Marie Callender’s, Healthy Choice, Slim Jim, Hebrew National, Orville Redenbacher’s, Peter Pan, Reddi-wip, PAM, Snack Pack, Banquet, Chef Boyardee, Egg Beaters, Rosarita, Fleischmann’s and Hunt’s. The Company sells its products in grocery, convenience, mass merchandise and club stores. CAG’s current market cap is $16.1 billion.
Earnings and Sales Growth: Over the last twelve months, earnings increased by about a little over 20%, while Revenues improved by 6.22%. Earnings increased in the last quarter by a little more than 12%, while sales growth was flat, but slightly negative at -0.13%, respectively. The company’s margin profile over the last twelve months is generally healthy, but showing signs of weakness. Income was 7.7% of Revenues over the past twelve months and declined to 5.46% in the last quarter.
Free Cash Flow: CAG’s free cash flow is $733 million over the last twelve months. That marks an increase from $696.2 million in the quarter prior, and $811.4 million a year ago. The current number also translates to a modest Free Cash Flow Yield of about 4.57%.
Debt to Equity: CAG has a debt/equity ratio of .91. That number has declined from 1.58 at the beginning of 2019, but the number remains a tad high, a reflection of the reality that the company’s liquidity is a significant question mark. In the last quarter Cash and liquid assets were about $79.7 million – a decline from $438.2 million in the last quarter of 2020, versus about $8.1 billion in long-term debt. Most of that debt is attributable to CAG’s acquisition of Pinnacle Foods in the last quarter of 2018, and it is true that the company has paid down more than $3.5 billion of that debt over the course of the last two years, which can at least partly explain the steady decline in cash and liquid assets.
Dividend: CAG pays an annual dividend of $1.25 per share – which the company increased from $.85 in its last earnings call of 2020, and $1.10 in 2021, and which translates to an annual yield of about 3.75% at the stock’s current price. An increasing dividend is a strong sign of management’s confidence in their business model and their operating success in the future.
Price/Book Ratio: there are a lot of ways to measure how much a stock should be worth; but I like to work with a combination of Price/Book and Price/Cash Flow analysis. Together, these measurements provide a long-term, fair value target at about $31 per share. That means the stock is somewhat overvalued at its current price, with -7% downside and a useful discount price at around $25. It is also worth noting that at the end of 2021, this same analysis put the stock’s fair value target at around $34.50 per share, and $45 during the first half of that year.
Technical Profile
Here’s a look at the stock’s latest technical chart.
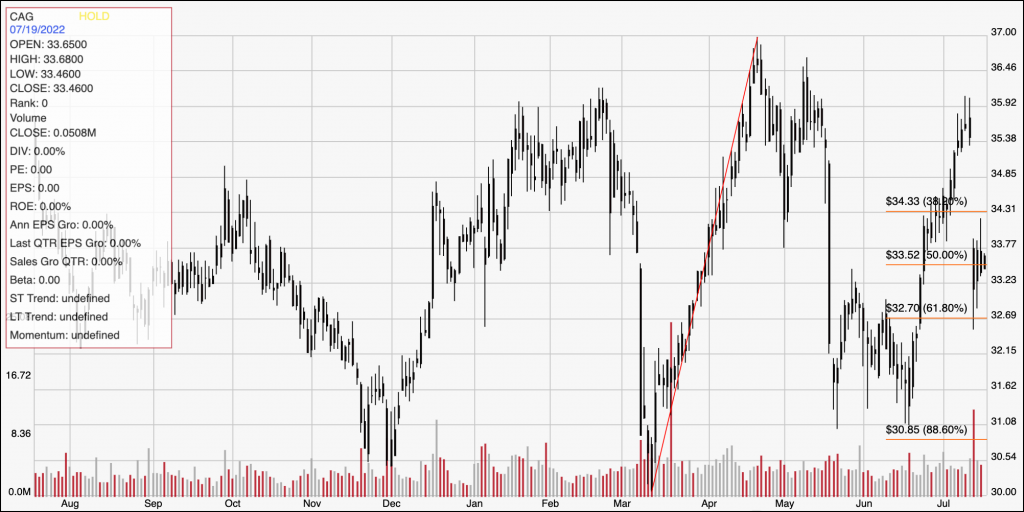
Current Price Action/Trends and Pivots: The chart above marks the stock’s price activity over the last year. The red diagonal line marks the stock’s upward trend from its 52-week low at around $30 to an April peak at around $37. It also provides the baseline for the Fibonacci retracement lines shown on the right side of the chart. The stock hit its latest pivot high this month at around $35 before dropping overnight following the latest earnings report to its current price at around $33. That is also roughly inline with the 50% retracement line to mark current support, with immediate resistance at the 38.2% retracement line around $34. A push above $34 has limited immediate upside to next resistance at the stock’s July high around $35, while a drop below $33 could have downside to next support at around $31 where the 88.6% retracement line sits.
Near-term Keys: From a fundamental standpoint, CAG’s profile has lost quite a bit of the luster it showed in 2021, with the latest earnings report doing little to improve the picture. There is also no practical way right now to suggest the stock offers a useful value to make it an attractive long-term, defensive buying candidate. That means that the best probabilities if you want to work with CAG lie in short-term, momentum-based trading strategies. You could use a push above $33 as a signal to consider buying the stock or working with call options, with an eye on $34 as a quick-hit profit target. A drop below $33 could be a useful signal to consider shorting the stock or buying put options, with $31 providing a reasonable bearish profit target.