In a year when the broad market’s bearish momentum seems to have infected just about every sector and industry, it can be hard to find stocks that are actually going up. When you do come across one, it’s notable enough that even a hardened bargain hunter like me has to sit up and take notice.
The Food Products industry in the Consumer Staples sector is an area of the market that tends to get overlooked because, let’s face it, it just isn’t very sexy. Even so, it is one of very few segments of the market that saw consumer-driven improvements in demand through the worst of the pandemic and into 2021. That gave a lot of companies in the industry a lot of strength versus stocks in trendier industries. Eating at home is also a trend that since then has seen a lot of analysts and economists argue about its “stickiness” – meaning that what may have initially been a natural reaction to extreme conditions could constitute a long-term change in consumer behavior.
“Stickiness” in this case means that the longer consumers rely on cooking and eating at home, the more likely that behavior is to become ingrained. That doesn’t mean we as consumers don’t appreciate the opportunity to go out and enjoy the socialization associated with restaurants, theaters, and so on. Even so, I think food-at-home is something that will “stick” as a natural behavior for fiscally conservative families. I think that one of the things that is likely to encourage this behavior is the reality of inflation and the impact of rising consumer prices on a typical family budget. More and more analysts and economists that I have been following are forecasting continued economic struggle this year, driven by cost increases that have prompted just the first of multiple expected interest rate increases last month. As those rising costs put the pinch on discretionary income, I think families will be forced to focus their budgets on brands in the Food Products industry that emphasize value.
Another interesting layer of the stay-at-home trend for Food Products relates to pets. Pet food is a highly competitive segment of the Food Products industry, but something that analysts like to see as part of a diversified company portfolio. A secondary increase in demand in pet food is likely to see very healthy stickiness owing to reported increases in new pet adoptions over the last two years that have continued until now. Makes sense, doesn’t it? Even if social restrictions are generally gone and most activities have returned to some form of “normal,” the fact is the last two and half years have made the emotional support offered by a cuddly puppy or kitty more compelling for children and adults alike. That means that the Food Products companies that have pet food and pet products as part of their business portfolio have a useful second leg to keep revenues healthy on a long-term basis.
One of the reasons I gravitate to Food Products, and the Consumer Staples sectors in general is that while these stocks aren’t immune from market momentum, they also typically display lower volatility characteristics than the most buzz-worthy stocks. In 2022, this idea has been reinforced by the way most stocks in the industry have weathered high uncertainty driven by everything from long-term COVID questions to Russia’s invasion of Ukraine, to the supply issues I already mentioned, all of which are pressuring input costs and increasing prices all the way to the consumer. While the broad market remains in strong bear market territory, some Food Products stocks have not only been stable, but managed to buck the market and see material increases in price.
General Mills, Inc. (GIS) is a stock that I’ve followed for quite some time, and even used on a few different occasions over the last couple of years in my value-based, income-oriented investments. Its usefulness as a defensive position was proven out in 2020, as the stock dropped only about -10% during the initial broad market push to bear market levels, but then pushed more than 22% above its pre-pandemic highs by the beginning of August of last year. Over the past year, the stock has increased by about 22.5%, and hit a new 52-week high earlier this month at around $77. GIS is also a company with a generally solid fundamental profile; what does the stock’s increase over the past year, including its roughly 9% rise in 2022 say about its current value proposition? Let’s find out.
Fundamental and Value Profile
General Mills, Inc., is a manufacturer and marketer of branded consumer foods and pet food products sold through retail stores. The Company is a supplier of branded and unbranded consumer food products to the North American foodservice and commercial baking industries. It also provides pet food products through its subsidiary Blue Buffalo Pet Products Inc. The Company has four segments: U.S. Retail, International, Pet operating, and Convenience Stores and Foodservice. The Company offers a range of food products with a focus on categories, including ready-to-eat cereal; convenient meals, including meal kits, ethnic meals, pizza, soup, side dish mixes, frozen breakfast and frozen entrees; snacks, including grain, nutrition bars and frozen hot snacks; yogurt, and super-premium ice cream. The Company’s other product categories include baking mixes and ingredients, and refrigerated and frozen dough. It also provides food products for dogs and cats. GIS’s current market cap is $43.8 billion.
Earnings and Sales Growth: Over the last twelve months, earnings increased 23.08%, while revenues were 8.13% higher. In the last quarter, earnings increased by 33.33%%, while sales also increased by 7.8%. GIS operates with a healthy, stable margin profile that is showing useful signs of strength; over the last year, Net Income was 14.25% of Revenues, and strengthened in the last quarter to 16.82%.
Free Cash Flow: GIS’s free cash flow is generally healthy, at $2.75 billion, and translates to a Free Cash Flow Yield of 6.28%. This marks an increase from the quarter prior, when Free Cash Flow was a little under $2.5 billion.
Dividend Yield: GIS’s dividend is $2.16 per share, and translates to an annual yield of about 3.09% at the stock’s current price. It is also worth noting that the company increased their dividend in 2020 – a rarity in the market at the time – from $1.96 per share, and again from 2.04 per share after the latest earnings report. GIS is also one of a very select number of companies, having paid an uninterrupted dividend for 122 years. Think about that for a moment; this is a company that has prioritized returning value to its shareholders via dividend payout, and maintained that discipline for more than a century, across two world wars, two pandemics, and multiple global financial crises including the Great Depression and (more recently) the Great Recession of 2008.
Debt to Equity: GIS has a debt/equity ratio of 0.85. High debt/equity is pretty typical of stocks in the Food Products industry, and in this case GIS’ ratio has come down markedly, from 1.12 at the end of last year, and from its 2018 peak at more than 1.92, which came from the completion of the company’s acquisition of Blue Buffalo Pet Foods. Their balance sheet shows liquidity, which had weakened through most of 2019, but improved through most of 2020 and the first part of 2021 has also faded; in the last quarter, cash and liquid assets were a little over $569 million. This number was about $532.7 million at the beginning of 2019 and $626 million in February 2020 before the pandemic began, but rose to $2.75 billion in the first quarter of 2021 and was $1 billion three quarters ago. They also currently have about $9.1 billion of long-term debt. The company’s margin profile indicates that debt service isn’t a problem.
Price/Book Ratio: there are a lot of ways to measure how much a stock should be worth; but I like to worth with a combination of Price/Book and Price/Cash Flow analysis. Together, these measurements provide a long-term target at about $61 per share. That suggests GIS is overvalued by -17%, with a practical bargain price for the stock at around $49 per share. It should also be noted that the start of this year, this same analysis yielded a Fair Value target of $55 per share.
Technical Profile
Here’s a look at the stock’s latest technical chart.
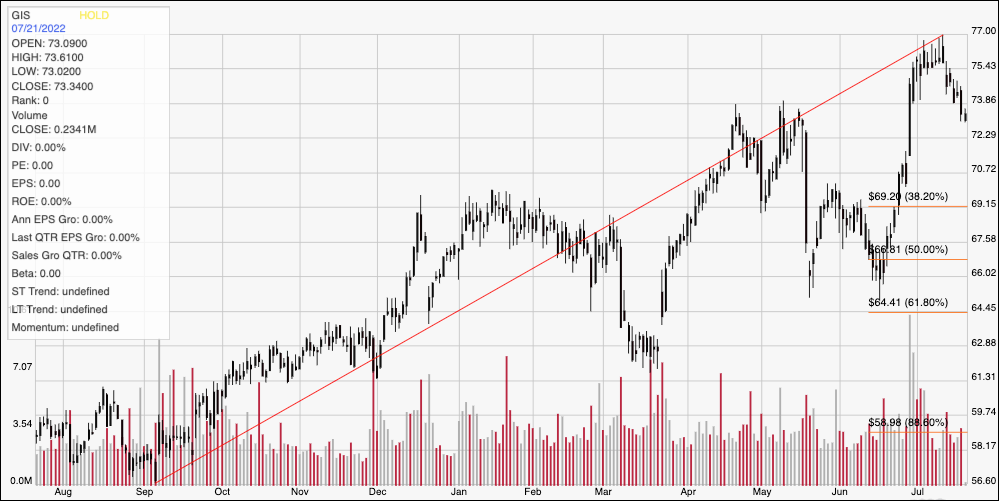
Current Price Action/Trends and Pivots: This chart traces the stock’s movement over the last year. The red diagonal line marks the stock’s upward trend from a September 2021 low at around $56.50 to its high a couple of weeks ago at $77. It also provides the baseline for the Fibonacci retracement lines shown on the right side of the chart. The stock has dropped off of that high and is right around current support at $73, based on pivot high activity in April and May. Immediate resistance is back the stock’s 52-week high at $77. A drop below $73 could see the stock fall to about $69 to next support, where the 38.2% retracement line sits. Using the current distance between support and resistance suggests that a push above the yearly high at $77 should have near-term upside to about $81 before finding next resistance.
Near-term Keys: If you’re looking for a short-term, bullish trade, you could use a bounce off of current support at $73 as an opportunity to buy the stock or work with call options, using $77 as a useful profit target and additional upside to $81 if buying activity increases. A drop below $73, on the other hand could work as a signal to consider shorting the stock or buying put options, with a useful, conservative target price in the $69 range on a bearish trade. From a fundamental, value-oriented perspective, GIS offers a generally solid profile and interesting dividend; but while Free Cash Flow has been stable, declines in liquidity over the past year, along with the fact the stock is clearly overvalued are more than sufficient reasons to put GIS aside for now and check again in a quarter or so.