The Tech sector often leads the broad stock market’s movements. As a value investor, the rush into Tech during a bull market leaves me a little cold; but when the market has turned bearish, and people are running away from Tech stocks en masse, I think the opportunity to find great value starts to get more and more interesting.
While the Tech sector led the market through 2020 and 2021 to the upside, it’s become something of a red-headed stepchild in 2022. Supply constraints that started prior to the pandemic, but continue to persist have been compounded by increasing interest rates along with geopolitical tensions this year, and that has pushed most of the biggest names in the Tech sector into their own respective bear markets. That big push to the downside included just about every industry, including Semiconductors.
In the semiconductor space, I like to pay attention not just to the producers – Intel, Advanced Micro Devices, Samsung Electronics, and so on – but also the companies that provide solutions and services to aid their production. That means equipment manufacturers, like Applied Materials Inc. (AMAT) are always of interest. This is a company whose balance sheet has held up extremely well throughout the past two years, even with concerns about chip supply.
After rallying from a pandemic-driven low at around $54 in 2020, the stock peaked at the start of this year at around $167 – more than tripling in value and making one of the clear standouts in a sector that clearly stood above the rest during that period. However, the broad market’s bearish momentum has pushed the stock more than -35% lower since then and into its own intermediate-term downward trend. Since the start of July, however the stock has rallied from a trend low at around $83 to its current value at around $100. Could the rally mark a potential turning point for the downward trend? Are the company’s fundamentals strong enough as well to suggest the stock could offer a useful value proposition at its current price? Let’s dive in to find out.
Fundamental and Value Profile
Applied Materials, Inc. provides manufacturing equipment, services and software to the global semiconductor, display and related industries. The Company’s segments are Semiconductor Systems, which includes semiconductor capital equipment for etch, rapid thermal processing, deposition, chemical mechanical planarization, metrology and inspection, wafer packaging, and ion implantation; Applied Global Services, which provides integrated solutions to optimize equipment and fab performance and productivity; Display and Adjacent Markets, which includes products for manufacturing liquid crystal displays, organic light-emitting diodes, upgrades and roll-to-roll Web coating systems and other display technologies for televisions, personal computers, smart phones and other consumer-oriented devices, and Corporate and Other segment, which includes revenues from products, as well as costs of products sold for fabricating solar photovoltaic cells and modules, and certain operating expenses. AMAT has a current market cap of $87.6 billion.
Earnings and Sales Growth: Over the last twelve months, earnings increased by 13.5%, while sales improved by about 12%. In the last quarter, earnings declined -2.2% while sales were flat, but -0.41 lower%. The company’s margin profile is impressive; Net Income versus Revenue was 26.48% over the last twelve months, but tapered to 24.6% in the last quarter. The narrowing in the last quarter is less than ideal, but given the level of Net Income to Revenue not a major concern.
Free Cash Flow: AMAT’s Free Cash Flow is strong, at $5.2 billion. This number is up over the last year, from $4.9 billion, but dropped in the last quarter from $5.9 billion. The current number translates to a modest Free Cash Flow Yield of 6.57%.
Debt to Equity: AMAT has a debt/equity ratio of .47, which is conservative, and implies debt management shouldn’t be a problem. The company has nearly $3.9 billion in cash and liquid assets, against $5.4 billion in total long-term debt.
Dividend: AMAT pays an annual dividend of $1.04 per share – an improvement from $.80 in 2019, $.88 in early 2021, and $.96 before the last earnings announcement – and which, at its current price translates to a dividend yield of about 1.02%. While the yield isn’t impressive, the fact is that an increasing dividend payout is a strong sign of management’s confidence in the road ahead and their intent to return value to their shareholders.
Price/Book Ratio: there are a lot of ways to measure how much a stock should be worth; but I like to work with a combination of Price/Book and Price/Cash Flow analysis. Together, these measurements provide a long-term, fair value target around $96 per share. That means that AMAT is overvalued, with about -5% downside from its current price, with a practical bargain price for the stock at around $77.
Technical Profile
Here’s a look at the stock’s latest technical chart.
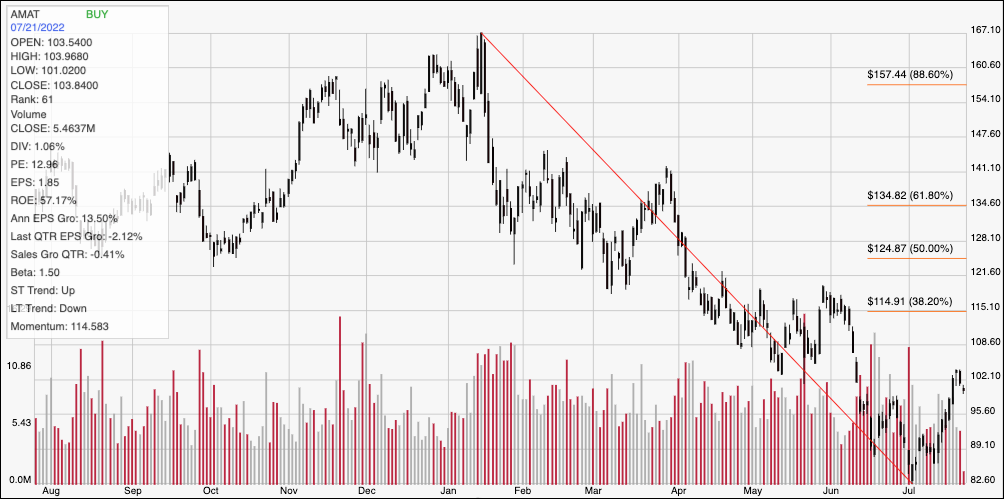
Current Price Action/Trends and Pivots: The chart above covers the last year of price activity. The red line traces the stock’s downward trend from a January peak around $167 to its low to start July at around $82.50. It also provides the baseline for the Fibonacci retracement lines shown on the right side of the chart. The stock has been rallying off of that low point, but found new, immediate resistance at the end of last week at around $103 per share and has dropped from that point. Current support should be at around $96 based on the stock’s pivot high around that level in June. A drop below $96 should find next support at around $89, but if selling pressure keeps up it could also revisit its yearly low at around $82.50. A push above $103 should give the stock room to rally to about $108 before finding next resistance, with $115 possible where the 38.2% retracement line sits if buying momentum increases.
Near-term Keys: If you prefer working with short-term, momentum-based trades, I think the stock’s price activity could offer some interesting set ups. A push above $103 would be a good signal to consider buying the stock or working with call options, with $108 providing an attractive short-term target. A drop below $96, on the other hand could be a good signal to consider shorting the stock or buying put options, with a target profit price at around $89. What about the value proposition? AMAT’s fundamentals are solid; but even with the big drop in price to this point, the stock still has further to go before it offers an attractive value proposition.