Throughout 2022, one of the biggest storylines in the marketplace has been the pace of inflation. It’s been reflected in rising prices across the board all the way to the consumer level. One of the places it has been most clearly seen is the price of crude.
West Texas Intermediate (WTI) crude, which acts as the benchmark for oil produced throughout North America started the year a little below $70 per barrel, and by early March hit a peak at around $130 per barrel, and came close again in June at around $124. While it has fallen off of that peak in the months since, WTI remains around $19.50 per barrel as of this writing. Even with the drop (a little over -25% since the June peak), WTI remains at levels not seen in not quite a decade, with Brent just a little higher at around $97.50 right now. Crude isn’t the only energy-driven commodity to be affected, as natural gas prices have also spiked to highs not seen in nearly a decade as the war in Ukraine rages on and Russia – the largest energy exporter into Europe prior to the war, and one of the biggest natural gas producers in the world – remains increasingly isolated, economically as well as politically.
In the Energy sector, there are a lot of different industries to think about, with a wide range of types of businesses related to it. It’s easy to correlate Energy to crude oil, because that is the single commodity that most of the companies in the sector are tied to in one way or another; but there are a lot of other product types that make up a significant part of this sector. One of those is natural gas liquids (NGL), which like crude itself have uses in a number of other segments of the economy such as petrochemicals, home heating, cooking and refrigeration, synthetic rubber for tires, vehicle fuel blends and more.
Natural gas, and NGL’s have their own place in the current economic and geopolitical climate. Russia is the world’s leading producer and exporter of natural gas and has used its dependence on that commodity as a justification for its aggression, since a major portion of the pipelines that facilitate export of its natural gas to the rest of Europe run through Ukraine, and therefore have historically made the two countries reluctant but necessary partners. No matter your view of events unfolding in that part of the world, there is no question that the longer the conflict continues, the greater the impact it will continue to have on worldwide energy supply and therefore is likely to keep energy prices elevated. That also means that for North America as well as every other part of the Western world, other sources for natural gas will come at a premium.
NGLs are an area that has experienced a growing level of exploration and production in the U.S., which means that companies that operate in this segment of the Energy sector, along with standard crude operations, have a useful second business leg to work from, and that I expect to provide a significant tailwind for the foreseeable future. Economic activity in the U.S. so far remains generally healthy, which along with the global pressures mentioned above means energy demand should is also expected to stay elevated for natural gas and NGLs. Many of the most interesting companies in this sector that have found a way to navigate difficult conditions of the last two years did so in part by figuring out how to operate successfully even amid depressed commodity prices, which means that healthy demand should boost these company’s profitability and long-term results even more.
Energy Transfer LP (ET) is a mid-cap company in the oil, gas & consumable fuels industry that focuses a primary portion of its business in natural gas assets, including storage facilities and transportation assets. This is a company whose balance sheet has been among the most healthy in its industry, even during the pandemic. After more than doubling in price from its 2020 low point at around $5 by July of last year, the stock dropped back into a short-term downward trend that finally found bottom at around $8 in December. Increasing crude and natural gas prices from that point pushed the stock back into a new upward trend through May, where it peaked at around $12.50, and then again June before dropping to an early July low at around $9.50. Through the rest of the month of July and into August, the stock has picked up a new set of bullish momentum, hitting its most recent pivot high at around $11.50 at the end of last week. It’s been dropping off of that high since then, but appears to be stabilizing a little below $11 as of this writing. That could be an interesting new, momentum-based opportunity for short-term traders in a stock that also has some interesting fundamental strengths going for it. The question, of course is whether those strengths also support the notion that the price should be higher, or whether the stock’s useful, value-driven opportunity has already been played out.
Fundamental and Value Profile
Energy Transfer LP owns and operates a portfolio of energy assets. The Company’s operations include complementary natural gas midstream, intrastate and interstate transportation and storage assets; crude oil, natural gas liquids (NGL) and refined product transportation and terminalling assets; NGL fractionation; and various acquisition and marketing assets. Its segments include intrastate transportation and storage, interstate transportation and storage, midstream, NGL and refined products transportation and services, crude oil transportation and services, investment in Sunoco LP, investment in USAC, and all other. Through its intrastate transportation and storage segment, the Company owns and operates natural gas transportation pipelines and three natural gas storage facilities located in the state of Texas. Its intrastate transportation and storage segment focus on the transportation of natural gas to markets from various prolific natural gas producing areas. ET has a current market cap of $33.7 billion.
Earnings and Sales Growth: Over the last twelve months, earnings were 95% higher, while sales increased almost 72%. In the last quarter, earnings improved by about 5.41% while sales were 26.6% higher. The company’s margin profile over the last twelve months showed Net Income was 4.59% of Revenues, and strengthened to 5.11% in the last quarter.
Free Cash Flow: ET’s Free Cash Flow is very healthy, despite the fact that has dropped over the last year; over the last twelve months, this number was about $5.8 billion versus $5.3 billion in the quarter prior, and about $8.2 billion a year ago. The current number translates to a very healthy Free Cash Flow yield of 16.77%.
Debt to Equity: ET has a debt/equity ratio of 1.39, which is generally higher than I prefer to see, but which is also not unusual for stocks in this industry. As of the last quarter, cash and liquid assets were $353 million versus $48.1 billion in long-term debt. Liquidity from cash and liquid assets has decreased significantly, from about $1.1 billion in the quarter prior. but that can be attributed to the company retiring about $700 million of long-term in the quarter. The company’s operating profile and free cash flow are good indicators that debt service isn’t a problem.
Dividend: ET pays an annual dividend of $.92 per share, which at its current price translates to a dividend yield of about 8.45%. The company also announced an increase in its dividend payout during its most recent earnings report, from $.80 to the current level. It is also worth noting that the dividend payout was around $.70 per share, per annum at the start of this year An increase in dividend distributions is a strong indicator of management’s confidence in its long-term approach.
Price/Book Ratio: there are a lot of ways to measure how much a stock should be worth; but I like to work with a combination of Price/Book and Price/Cash Flow analysis. Together, these measurements provide a long-term, fair value target at around $12.70 per share, which suggests that ET is nicely undervalued, with 17% upside from its current price.
Technical Profile
Here’s a look at the stock’s latest technical chart.
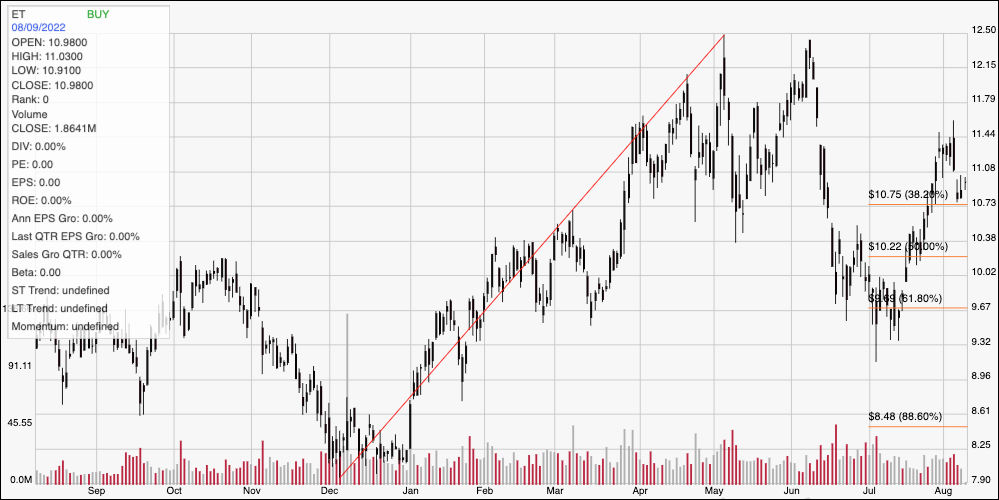
Current Price Action/Trends and Pivots: The chart above displays the last year of price activity for ET. The red diagonal line traces the stock’s upward trend from its December 2021 low at around $8 to its high reached in May and again in June at around $12.50; it also provides the baseline for the Fibonacci retracement lines shown on the right side of the chart. After dropping through the rest of June to a low in the first week of July at around $9.50, the stock has picked up bullish momentum again, driving above all of its major retracement lines to mark current support at around $10.75 where the 38.2% retracement line sits. Immediate resistance is at the last pivot high, a little above $11. A push to $11.50 should see the stock retest its 52-week high at $12.50, with additional upside to about $13.50 if buying momentum continues. A drop below $10.75 should find next support at around $9.50 where the 61.8% retracement line sits.
Near-term Keys: ET’s healthy Free Cash Flow over the last year, along with improving Net Income, and an increasing dividend payout is a strong sign of fundamental strength in a stock with a still-interesting value proposition. If you prefer to focus on short-term trading strategies, you could a push above $11.50 to consider buying the stock or working with call options, using $12.50 as a practical near-term bullish target price. With limited downside, While there isn’t a ton of downside, you could consider shorting this stock or buying put options if the stock drops below $10.75, using $9.50 as a quick-hit profit target on a bearish trade..