Value analysis, or growth-focused, momentum-based trading? Most investors tend to think of these two approaches as being in diametric opposition to each other as incompatible methods.
Looking for stocks at the low side of their historical ranges is a no-brainer approach for a value-oriented investor, because generally increases the odds that the stock will represent a good bargain. It’s an idea that that growth-focused investors and traders don’t embrace, because even the newest, least experienced investor already has it drilled into their head that a stock that has already been going up is more likely to keep going up. That is often true, especially when the entire market is in the midst of a long-term bullish trend, but it also ignores the flip side, which is that since every stock experiences highs and lows, no bullish trend lasts forever.
Extending the logic I just described also means that even the most drastic downward slide will eventually find a turning point. Technical traders recognize that the early stages of trend reversals are where the best, highest-probability profits are generally found, which is why I have learned to combine my value-focused analysis with attention to the technical aspects of price activity, including trend continuations and reversals. That is especially true if the company’s fundamental profile is strong; the combination of fundamental strength with bearish price activity often means that the stock is priced well below what the “intrinsic,” or built-in value of the underlying business actually is.
The opposite logic to what I just described is also true. Value seekers tend to be naturally drawn to sectors and stocks that have been following extended downward trends because these are the kinds of situations that are most likely to translate to useful value; but the caveat is that the underlying fundamental strength of the company’s business has to be strong enough to suggest that the stock’s current price represents a discount. It isn’t enough simply to see a stock in a downward trend and so to assume that the value is there. That’s another reason I’ve learned to combine price action, fundamental strength, and valuation analysis into a three-pronged approach to determine whether I think a stock represents the right kind of opportunity I need.
Corning Inc. (GLW) may be just the kind of stock right now that I’m talking about. If you’re not familiar with the company name, I’m willing to bet you are familiar with one of their most popular products – Gorilla Glass, which is used in a variety of applications and industries, but might be most easily recognized for its place in the automotive industry and in telecommunications, where for example its Ceramic Shield is used exclusively for the latest generations of the iPhone. For me, the great thing about that name recognition is that Gorilla Glass comes from the Specialty Materials business segment, which represents the smallest portion of their total revenues; they also have a significant presence in Display Technologies (laptops, flat panel desktop monitors, and televisions), and Optical Communications (manufacturing optical fiber and cable and providing optical solutions across the communications industry).
From a peak in February of this year at $43.50, the stock dropped into a downward trend until October, when it may have finally found a bottom at around $29 per share. The stock has rallied from that point, pushing to its current price a little above $33 and building bullish momentum that could point to a useful reversal of the longer downward trend. Do the company’s fundamental lend strength to the argument that the stock should be higher? Let’s dive in and find out.
Fundamental and Value Profile
Corning Incorporated is a materials science technology and innovation company. The Company’s segments include Display Technologies, Optical Communications, Environmental Technologies, Specialty Materials and Life Sciences. The Display Technologies segment manufactures glass substrates for flat panel liquid crystal displays and other high-performance display panels. The Optical Communications segment manufactures carrier network and enterprise network components for the telecommunications industry. The Environmental Technologies segment manufactures ceramic substrates and filters for automotive and diesel applications. The Specialty Materials segment manufactures products that provide more than 150 material formulations for glass, glass ceramics and fluoride crystals. The Life Sciences segment manufactures glass and plastic labware, equipment, media, serum and reagents enabling workflow solutions for drug discovery and bioproduction. GLW’s current market cap is $28 billion.
Earnings and Sales Growth: Over the last twelve months, earnings declined by about -9% while revenue was -3.5% lower. In the last quarter, earnings shrank by -10.5%, while revenues were -3.5% lower. The stock’s operating profile over the last twelve months is showing deterioration, with Net Income at 12.72% of Revenues over the last twelve months, and weakening markedly to 5.96% in the last quarter.
Free Cash Flow: GLW’s free cash flow is healthy, at $1.2 billion. This number translates to a Free Cash Flow Yield of 4.44%. This does mark a drop from the last quarter, when Free Flow was $1.45 billion and $1.8 billion a year ago.
Debt to Equity: GLW has a debt/equity ratio of .57, which reflects a conservative approach by management to leverage. Their balance sheet also shows about $1.63 billion in cash and liquid assets (compared to $2.1 billion a year ago) versus about $6.5 billion in long-term debt. It’s worth noting that GLW’s debt – which is more than serviceable – has an average maturity of 10 years, giving the company plenty of time to work with, while also preserving liquidity and operating flexibility. Long-term debt was also nearly $7 billion a year ago. Eliminating $500 million in debt while net income, free cash flow, and liquidity have all declined is a net positive, however I do believe the declines in free cash flow and net income is a pattern that bears watching in the quarters ahead. It could be indicative of broader, inflation-driven cost increases rather than fundamental problems within the company, but how the company continues to respond to those conditions will determine if these numbers continue to decline, stabilize, or (in a best-case scenario) reverse.
Dividend: GLW pays an annual dividend of $1.08 per share, which translates to a yield of 3.28% at the stock’s current price. Management increased the dividend from $.88 per share at the beginning of 2021 and $.96 at the start of 2022, confirming their confidence in the company’s prospects.
Price/Book Ratio: there are a lot of ways to measure how much a stock should be worth; but I like to work with a combination of Price/Book and Price/Cash Flow analysis. Together, these measurements provide a long-term, fair value target around $43 per share. That suggests that GLW is undervalued, with about 32% upside from its current price.
Technical Profile
Here’s a look at the stock’s latest technical chart.
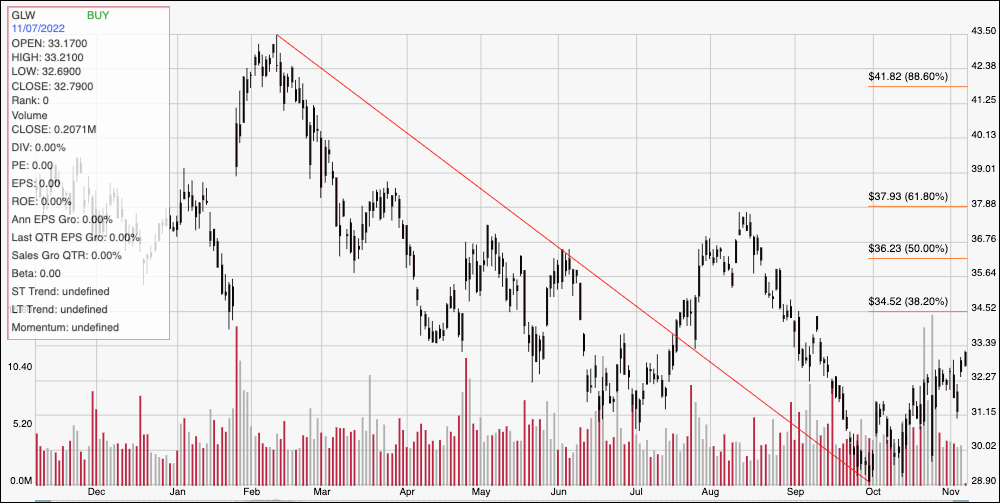
Current Price Action/Trends and Pivots: The chart above displays GLW’s price action over the past year. The diagonal red line traces the stock’s downward trend from its high in February at around $43.50 to its low in October at around $29 per share; it also provides the reference for calculating the Fibonacci retracement levels indicated by the horizontal red lines on the right side of the chart. The stock has rallied strongly from that October low, pushing to about $33 as of this writing, with immediate resistance sitting at around $34.50 where the 38.2% retracement line sits. Current support is around $32, based on pivot activity in late October as well as in June and July. A drop below $32 should find next support at about $31, however a drop below $31 should see the stock retest its yearly lows at around $29. A push above $34.50 could have near-term upside to about $37, with additional room to about $38 where the 61.8% retracement line sits if buying activity accelerates.
Near-term Keys: GLW is a stock that I think offers very intriguing possibilities for a long-term, value-oriented investor. The company’s fundamentals are generally solid, even with some effects coming from current economic pressures. Along with a stable, consistent dividend that has been increasing in each of the last three years and a useful value proposition, I think GLW is worth taking a long look as a useful long-term opportunity. If you prefer to work with short-term trading strategies, you could use a push above $34.50 to buy the stock or work with call options, keeping an eye on $37 as a practical, exit point. A drop below $32 has limited downside, which means the stock would need to drop below $31 to offer a useful signal to consider shorting the stock or buying put options. In that case, an exit target around $29 could offer a useful profit target on a bearish trade.