Each year, it seems that analysts and pundits alike spend a significant amount of time trying to identify the driving elements of market and economic activity. In a 2022 that has seen a lot of newsworthy events from war to inflation and everything in between, I think there is one word we can use to summarize it all: uncertainty.
Economic uncertainty usually suggests that cyclically-sensitive industries are the most exposed to downside risk. One of the industries that certainly fits that general description is the Auto industry. As measured by the Nasdaq Global Auto Index ETF (CARZ), this is an industry that dropped more than -42% from its high a year ago to a low in October. The decline has been exacerbated by supply chain challenges, increasing fuel prices that started in late 2021, and were compounded by the Russia-Ukraine war. Rising interest rates to head off accelerating inflation only continues to keep pressure in cyclically sensitive industries like Autos and Auto Companies high, making them more vulnerable than other industries and sectors right now.
MGA is a Canadian company whose biggest customers include the Detroit Big Three automakers and German brands Daimler, BMW and Volkswagen. And while they’ve taken their lumps with the rest of the industry and the market, their balance sheet has remained resilient. They are also among the few companies in the industry that managed to maintain their dividend payout throughout the pandemic, and in fact raised their dividend payout following their earnings report in February of this year. They also have enough of a presence in the electrical vehicle (EV) market to see positive impacts from that continued, emerging auto trend, with additional tailwinds from that part of their business expected to be a growth driver into 2023.
Over the past year, the stock has dropped back into a long-term downward trend that picked up pace in August, falling from a pivot high at around $64 to its own October low at around $45.50. That put the total decline at around -50% from its yearly high at that point. The stock has picked up a lot of bullish momentum since then, with the market’s generally positive movement in the last week adding a boost that now has the stock nearing $63. The question, of course, is whether their overall fundamental strength, with that attractive dividend, and the stock’s current price action also make the stock a good value, or has the stock already moved pat the point of useful value? Here are the numbers.
Fundamental and Value Profile
Magna International Inc. (Magna) is a mobility technology company. The Company’s segments include Body Exteriors & Structures, Power & Vision, Seating System and Complete Vehicles. Its product capabilities include body, chassis, exterior, seating, powertrain, active driver assistance, electronics, mirrors & lighting, mechatronics and roof systems. Its products include sealing systems, sliding folding and modular roofs, active aerodynamics, lightweight composites, fuel systems, engineered glass, body systems, electronic controllers, interior mirrors, exterior mirrors, tail lamps, small lighting, seat structures, door systems, power closure systems, mechanism & hardware solutions, foam & trim products, complete vehicle manufacturing, engineering services and fuel systems. MGA has a current market cap of about $18.1 billion.
Earnings and Sales Growth: Over the last twelve months, earnings increased more than 91%; Revenues increased by a little over 17%. In the last quarter, earnings rose almost 29%, while sales were -1% lower. MGA’s operating profile has historically been narrow. In the last quarter; Net Income versus Revenues was 3.12%, marking a modest improvement from 2.57% over the last twelve months.
Free Cash Flow: MGA’s free cash flow is generally healthy, at $846 million. This number has declined over the last year, as shown by the fact Free Cash Flow was $1 billion in the quarter prior and $1.65 billion a year ago. The current number translates to a Free Cash Flow Yield of about 4.72%.
Dividend: MGA pays an annual dividend of $1.80 per share, which translates to an annual yield of 2.87% at the stock’s current price. The company has also increased the dividend from $1.32 per share, per year steadily since late 2018, and which includes an increase from $1.60 per share at the beginning of 2021. An increasing dividend is an indication of management’s confidence in their business and long-term strategy.
Price/Book Ratio: there are a lot of ways to measure how much a stock should be worth; but I like to work with a combination of Price/Book and Price/Cash Flow analysis. Together, these measurements provide a long-term, fair value target around $18 per share. That suggests that MGA is overvalued by -71%, with a practical discount price at around $14.50. It is also worth nothing that in the first quarter of this year, this same analysis yielded a fair value target at around $64 per share, and $37 as recently as the last quarter.
Technical Profile
Here’s a look at the stock’s latest technical chart.
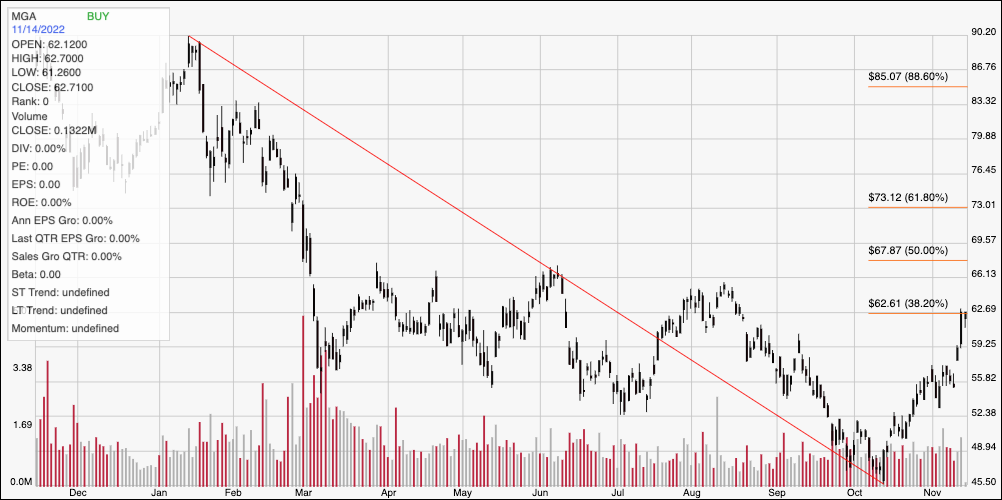
Current Price Action/Trends and Pivots: The chart above displays the stock’s price activity over the past year. The red diagonal line traces the stock’s downward trend from its peak at around $90 in January to its October low at around $45.50. It also provides the basis for the Fibonacci retracement lines on the right side of the chart. The stock has rallied strongly from that low, pushing to the 38.2% retracement line to find immediate resistance at around $62.50. Current support is around $59, based on pivot activity seen in that area at various points since March of this year. A push above $62.50 should find next resistance at around $66, where the stock peaked in March, April and May, while a drop below $59 should find next support at around $56 per share.
Near-term Keys: The stock’s current rally is almost to the point of providing a strong technical trend reversal signal. That mean that if the stock pushes above $66, a new bullish trend will be confirmed. That sounds like a great opportunity to buy the stock, however from a value-based standpoint the stock has also clearly moved past the point of useful value, making any kind of bullish trade strongly growth-oriented in nature. That also means that the best opportunities to work with the stock lie with short-term trading strategies. A push above $62.50 would be a good signal to consider buying the stock or working with call options provided you intend to use $66 as a decision point to either take profits quickly or reevaluate the emerging bullish trend’s strength. A pivot off of current resistance at $62.50 could also be a strong signal to consider shorting the stock or buying put options, with current support at around $59 providing a useful first exit target on a bearish trade, and $56 possible if selling momentum accelerates.