Happy Thanksgiving! The quest for useful value in the stock market is one of those things that applies to any market condition – bull, bear, or none. The current state of the market and the economy in general is what tends to shift the value focus from one sector to another.
2022 has been dominated by questions about inflation, interest rates, and the global, geopolitical concerns that continue to constrain supply and keep prices high. Inflation has remained high throughout the year, and that pushed energy prices to extreme highs in early June. While the benchmark prices for U.S. and global crude have dropped from those peaks, they still remain elevated, well above last year’s prices.
Some of the issues keeping oil prices high are global in nature, with serious geopolitical concerns. Russia’s war with Ukraine doesn’t have a near-term end in sight; that is putting a lot of pressure on the price not only of crude oil but also natural gas, as Russia is a major global exporter of both commodities, and with a significant amount of pipeline capacity to get those products out of Russia and to the rest of the world running through Ukraine. Along with still-healthy levels of demand, and a U.S. administration that is reluctant to increase drilling and exploration capacity, that suggests that oil prices are likely to remain elevated for some time.
Increasing energy prices can be a bit of a mixed bag for stocks in the energy sector. On the one hand, they imply that demand is high, which should contribute to increased revenues; but when demand isn’t addressed by increased capacity, it can also have a reverse effect, especially on the companies that focus on exploration and production. Rising inflation also generally implies rising input costs in areas that affect just about all sectors. Rising labor costs are a good example of one of the things that a lot of businesses have been forced to contend with in the last two years in order to attract and keep workers.
Suncor Energy Inc. (SU) is an integrated energy company, based in Canada, that has seen some material benefits from rising energy prices, with health cash flow and profitability metrics in place, but has also absorbed some impact form those rising costs that have affected other areas like available cash. The stock saw an impressive rally from an August 2021 low at around $16 to a peak in June above $42. From that point, the stock has dropped back into its own bear market, but appears to be finding a current bottom for that downward trend. If that bottom holds, it could provide a good launch point for a new bullish rally. Does that suggest that the stock’s most recent price activity could translate to a useful opportunity for long-term oriented investors? Let’s find out.
Fundamental and Value Profile
Suncor Energy Inc. is a Canada-based integrated energy company. The Company’s segments include Oil Sands, Exploration and Production (E&P), and Refining and Marketing. The Oil Sands segment includes the Company’s owned operations in the Athabasca oil sands in Alberta to explore, develop and produce bitumen, synthetic crude oil and related products, through the recovery and upgrading of bitumen from mining and in situ operations. The E&P segment includes offshore activity in East Coast Canada, with interests in the Hibernia, Terra Nova, White Rose and Hebron oilfields, the exploration and production of crude oil and natural gas at Buzzard and Golden Eagle Area Development in the United Kingdom, and exploration and production of crude oil and gas at Oda. The Refining and Marketing segment includes the refining of crude oil products, and the distribution, marketing, transportation and risk management of refined and petrochemical products, and other purchased products. SU has a current market cap of $48.2 billion.
Earnings and Sales Growth: Over the last twelve months, earnings increased by more than 157%, while revenues grew by about 42.3%. In the last quarter, earnings decreased by a little more than -32% while sales were -9% lower. The company’s margin profile is healthy, and strengthening; over the last twelve months, Net Income as a percentage of Revenues was 18.33%, and increased to 24.66% in the last quarter.
Free Cash Flow: SU’s free cash flow is very strong, at more than $7.7 billion over the last twelve months. That marks a decline from about $8 billion in the last quarter, but an increase from about $4.5 billion a year ago. The current number translates to a Free Cash Flow Yield of 16%.
Debt to Equity: SU’s debt to equity is .35, which is a conservative number. The company’s balance sheet indicates that operating profits are more than adequate to service their debt, with good liquidity. Cash and liquid assets were about $3.6 billion in the last quarter, while long-term debt was about $10.3 billion.
Dividend: SU’s annual divided is $1.56 per share, and which translates to a yield of about 4.35% at the stock’s current price. The dividend payout was also increased from $1.43 per share following the company’s latest earnings report.
Price/Book Ratio: there are a lot of ways to measure how much a stock should be worth; but I like to work with a combination of Price/Book and Price/Cash Flow analysis. Together, these measurements provide a long-term, fair value target at around $41.60 per share. That means that SU is undervalued right now, with about 16% upside from its current price.
Technical Profile
Here’s a look at the stock’s latest technical chart.
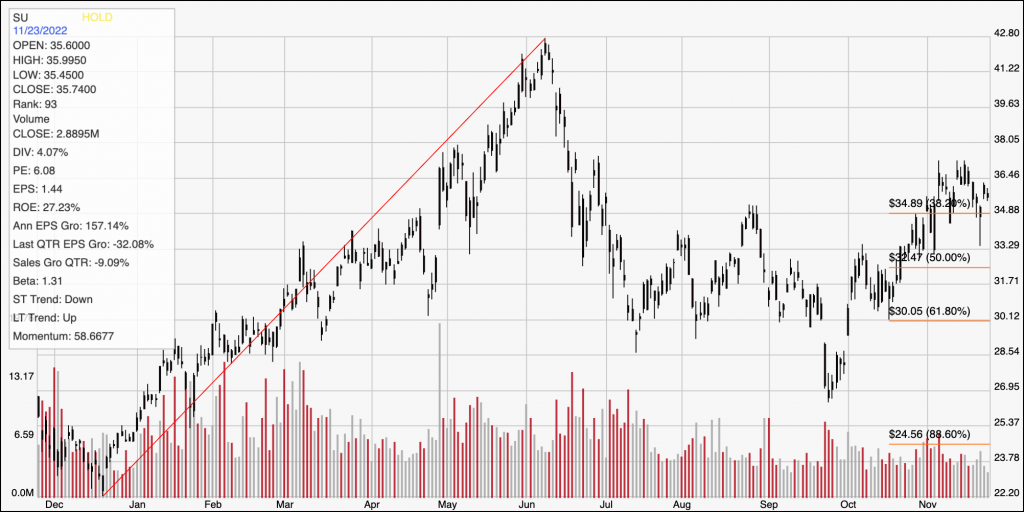
Current Price Action/Trends and Pivots: The chart above covers the last year of price activity. The red diagonal line traces the stock’s upward trend from a 52-week low at around $22 per share in December of last year to its peak in June at around $43. It also provides the baseline for the Fibonacci retracement lines shown on the right side of the chart. From its trend low at around 27 in September, the stock has rallied strongly, pushing above all of its major retracement lines to peak and mark immediate resistance at around $37 this month. Current support is around $35, right around the 38.2% retracement line. A drop below $35 could see the stock fall to about $32.50 before finding next resistance in the area of the the 50% retracement line. A push above $37 could see stock pick up enough bullish momentum to test the stock’s 52-week high at around $43 per share.
Near-term Keys: SU is an interesting stock in a sector that continues to offer useful value right now. This is a company with healthy free cash flow, and increasing profitability working in its favor. The current decline in Net Income is a concern, but could also be a cyclical issue, tied to the current environment of rising costs and bears watching. All the same, I think this is a stock that could offer a good long-term opportunity for a value-focused investor. If you prefer to work with short-term trading strategies, you could use a push above $37 as a signal to think about buying the stock or working with call options, using $43 as an attractive bullish profit target. A drop below $35, on the other hand could offer an opportunity to consider shorting the stock or buying put options, so long as you plan to take profits quickly, at around $32.50 per share on a bearish trade.