Having a contrarian temperament generally means doing the opposite of what most people would do. It’s a mindset that I’ve found very useful as an investor, because while most people tend to flock to stocks that are at or near all-time highs, I’m able to find excellent long-term opportunities at much lower, bargain-level prices.
Finding a good company at a nice price is a lot like combing through the clearance rack at a department store and finding a high-quality, name-brand piece of clothing for a fraction of its normal cost – you almost feel like you’re getting away with something everybody else is either too ignorant, or at least too impatient to take notice of. That doesn’t mean that just because a stock is trading at or near its historical lows, it’s automatically bargain. It’s also correct to say that the mere fact a stock could be at or near its yearly highs doesn’t automatically mean that a useful value proposition is now out of reach. That’s because the question of whether a stock offers a good value have a lot of different elements that come into play.
The major caveat to bargain hunting in the stock market is that in many cases efficient market theory holds – which is to say that sometimes a stock is cheap because it’s just a cheap stock, and deserves to be. History shows that in the long term, the market is very good at pricing the fundamental strength or weakness of a company into its stock price. Thus, efficient market theory asserts that the current price a stock is at is a fair reflection of the market’s perception of the company’s current health – or at least of the market’s expectation of strength or weakness. That’s why for a value-focused investor, simply seeing a stock at or near extreme lows isn’t actually enough to justify a long-term investment. A more detailed look at the underlying business, and how that translates into a dollar value representing how much the business is worth, is also required.
I spend a lot of time combing through stocks in every sector of the market, and every industry of those sectors to try to find opportunities for terrific value. The truth is that, no matter what current market conditions are, there are always stocks that can be found trading at levels below their actual business value. Identifying that “intrinsic value” of a business is a bit of a trick, but I’ve learned to rely on a stock’s Book Value as a primary measurement, with a comparison of the stock’s current price not only to its current Book Value, but also to historical levels to provide a market-driven context to frame the current picture against.
Sometimes, broad market conditions work against a company’s fundamentals in ways it can’t entirely control. Some sectors and industries are more susceptible to this kind of risk, which means that their stock prices tend to be more volatile. That generally means that while investing in these kinds of stocks can be very profitable over time, you also have to be willing to ride out periods of high, or even extreme volatility. The energy sector, and stocks in the exploration and production arena in particular is a good example of the volatility that can play a big role in stock prices. 2020 was a tough year for the entire Energy sector, first by a brief, but furious trade war between Saudi Arabia and Russia price war that drove crude prices across the globe as much as -50% lower. Just as most of that pressure was fading, COVID-19 became a global pandemic, collapsing demand for gasoline and crude for most of the year. 2021 saw some of that demand come back, but momentum in energy prices from late 2021 through 2022 so far has come from restrictions on capacity – driven initially by supply chain issues (that are still in place) and exacerbated by the war in the Ukraine and all of the geopolitical and economic fallout associated with it. That pushed the price of both West Texas Intermediate and Brent crude as high as nearly $130 per barrel in the first half of this year. Prices have slipped back to about $80 per barrel as of this writing, but still well above the levels they were at a year ago.
Because of pandemic-driven restrictions and pressures, even the strongest, most established companies absorbed significant hits to their operating margins and balance sheets that continue to play a role right now. Marathon Oil Corporation (MRO) is one of the biggest U.S. companies in the exploration and production space, but the market conditions I just outlined over the last three years put a lot of pressure on the stock’s price, dropping to a low at around $2 per share in early 2020, before staging a big rally through 2021 and to a peak at around $33 per share in July of this year. It’s rallied from that point, matching its yearly high at around $33.50 in November before slipping back to its current price at around $30. What does that mean for the stock’s value proposition? Let’s dive in to find out.
Fundamental and Value Profile
Marathon Oil Corporation is an exploration and production (E&P) company. The Company operates through two segments: United States E&P and International E&P. The United States E&P segment explores for, produces and markets crude oil and condensate, natural gas liquids (NGLs) and natural gas in the United States. The International E&P segment explores for, produces and markets crude oil and condensate, NGLs and natural gas outside of the United States, and produces and markets products manufactured from natural gas, such as liquefied natural gas (LNG) and methanol, in Equatorial Guinea (E.G.). MRO’s current market cap is about $19 billion.
Earnings and Sales Growth: Over the last twelve months, earnings increased by 218%, while sales grew by 54.65%. In the last quarter, earnings decreased by about -6%, while revenues declined by -2.43%. MRO operates with a margin profile that has gained strength as crude prices have risen and continue to show strength; Net Income versus Revenues over the past year was nearly 46%, and moderated in the last quarter to a little under 41%.
Free Cash Flow: MRO’s free cash flow over the last twelve month is healthy, and has gotten stronger over the past year,. Free Cash Flow in the last twelve months was $4.05 billion, versus $3.9 billion in the quarter prior and $2.2 billion a year ago. The current number also translates to an attractive Free Cash Flow Yield of 19.05%.
Debt to Equity: MRO has a debt/equity ratio of .32. This is a conservative number that speaks to management’s ability to use debt more effectively than a lot of competitors in the industry. In the last quarter, MRO’s balance sheet reported more than $1.1 billion in cash and liquid assets against about $3.5 billion in long-term debt. MRO’s healthy margins and improving free cash flow, along with the fact the company has retired approximately $1.4 billion in long-term debt over the past year and a half are solid signs that debt service is not a problem.
Dividend: MRO pays an annualized dividend of $.36 per share. At the stock’s current price, that translates to a dividend yield of 1.2%. It should be noted the company increased the dividend from $.32 per share, per annum after their last earnings announcement. While the payout remains conservative, an increasing dividend is a strong indication of management’s confidence in their business.
Price/Book Ratio: there are a lot of ways to measure how much a stock should be worth; but I like to work with a combination of Price/Book and Price/Cash Flow analysis. Together, these measurements provide a long-term, fair value target around $33.50 per share. That suggests that MRO is undervalued by about 12% from its current price, with a useful bargain price at around $27. It is also worth noting that in mid-2020, this same analysis offered a fair value target at around $9, and $24 per share in July of this year.
Technical Profile
Here’s a look at the stock’s latest technical chart.
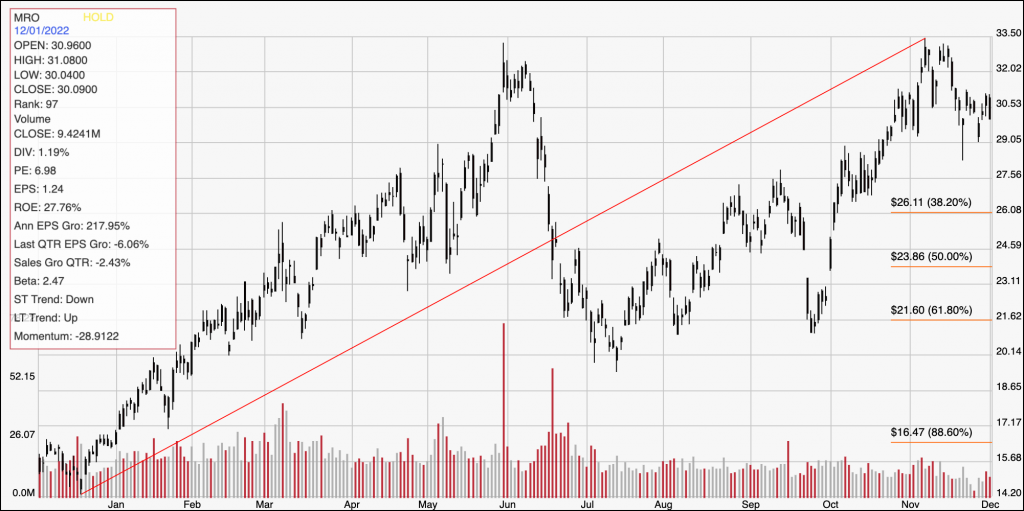
Current Price Action/Trends and Pivots: The diagonal red line traces the stock’s upward trend from its December 2021 low at around $14 to its November high at around $33.50; it also informs the Fibonacci retracement lines shown on the right side of the chart. Since dropping back to about $20 in July, the stock has staged a new upward trend that pushed the stock to its November peak before dropping back again leading into this month. Current support is around $29, where the stock has stabilized, with immediate resistance at that November peak at $33.50. A push above $33.50 could see the stock rally to about $38 if the current distance between support and resistance is used as a benchmark; a drop below $29, on the other hand should find next support at around $27.50 based on a lot of pivot activity in the spring and fall months of this year in that area, and $26 below that around the 38.2% retracement line.
Near-term Keys: MRO’s fundamentals are solid and confirm management’s ability to navigate troubled economic waters over time. The latest rally has, a bit surprisingly, not invalidated MRO as an interesting, if not quite compelling value opportunity. Keep in mind that even though most experts expect energy demand to remain high, this is a stock in a sector that has demonstrated plenty of volatility; so if you are thinking about using MRO for a long-term, value-based investment, you should be willing to accept the possibility of additional price volatility. If you prefer to work with short-term trading strategies, you could use a bounce of of $29 as a good signal to consider buying the stock or working with call options, with a near-term target price at around $33.50. A drop below $29 could be a signal to consider shorting the stock or buying put options, with an eye on the the last pivot low support at around $27.50 as a useful, initial profit target on a bearish trade and $26 possible if selling activity picks up.