For the last few years, the Auto industry has been an interesting pocket of the stock market to pay attention. Geopolitical, social, and global economic shifts have been clearly seen in this traditionally cyclical industry.
Trade tensions between the U.S. and its largest trading partners from tariffs imposed by the U.S. kept a lot of pressure on the entire industry leading into 2020, when the global COVID pandemic shuttered economic activity and collapsed demand for most of that year. 2021 saw a number of Auto companies show significant improvements in demand, and therefore in their bottom lines, which helped a lot of those stocks see impressive increases in price of 100% or more.
2022 set a bit of a different tone. Inflation and its resulting impact on interest rates started the uncertainty wagon rolling for the broad market, with geopolitical tensions being heightened by Russia’s extended war with Ukraine and its resulting, global impact. For automakers, the conflict represents a significant element of risk, as many of those companies have critical operations, either in Ukraine or Russia to make their products available in that part of the world. The war has necessitated suspension of production in many of those cases as automakers have followed the lead of their home countries who moved quickly to impose restrictive economic sanctions on Russia in the early stages of the invasion.
Automotive stocks have clearly been among the losers throughout 2022. The industry is down nearly -30% for the year, as measured by the NASDAQ Global Auto Index Fund (CARZ), with most of the drop occurring in the first three quarters. Since October, the industry appears to have stabilized, with many stocks consolidating at the lower end of their yearly trading ranges.
To be an effective value investor, I’ve found that you often have to be willing to move against the grain of the broad market; to me, that means that when everybody else says “stay away” from a certain industry the smarter thing is to actually go ahead and take a long look. If you want to find some of the best bargains in the marketplace at any given time, you’re going to be more likely to find them in deeply discounted stocks in depressed industries. That’s one of the biggest reasons that current market conditions led me to take a deep dive to start this week on Ford Motor Company (F).
F is a company that has held my interest for some time; they were the only U.S. automaker that didn’t participate in the federal bailout of the industry in 2008, choosing instead to stand or fall on their own merits. The onset of the COVID pandemic forced F, along with most of the industry to suspend its dividend payments, but the company also set itself apart from its industry brethren by being the first to reinstate their dividend payout in November of 2021. Despite the challenges associated with the last three years, the company boasts a strong balance sheet. They are also among the most aggressive of the major U.S. automakers in shifting production over time of 40% their product line to electrical engines, confirming a broad consumer trend that has only gained momentum over the last few years.
Those are the positives. High interest rates, which aren’t expected to begin dropping until late 2023 at the earliest, are a big headwind for the industry as a whole, as borrowing for a new car purchase becomes more and more expensive. Among the ripple effects of the war in Ukraine, and the exit of every major automaker, including Ford, from operations in that country is a tightening of supply that has only elevated new and used car prices throughout the year. With several risk elements in place, it isn’t surprising to see the stock near its yearly low, and down more than -43% from its 52-week peak seen in mid-January at around $26 per share. Does the stock’s current price action, considered against the company’s fundamental strength, mean that it could offer an interesting value-driven opportunity right now? Let’s find out.
Fundamental and Value Profile
Ford Motor Company is a global automotive and mobility company. The Company’s business includes designing, manufacturing, marketing, and servicing a full line of Ford cars, trucks, and sport utility vehicles (SUVs), as well as Lincoln luxury vehicles. The Company operates in four segments: Automotive, Financial Services, Ford Smart Mobility LLC, and Central Treasury Operations. The Automotive segment primarily includes the sale of Ford and Lincoln brand vehicles, service parts, and accessories across the world. The Financial Services segment primarily includes its vehicle-related financing and leasing activities at Ford Motor Credit Company LLC. Ford Smart Mobility LLC is a subsidiary formed to design, build, grow, and invest in emerging mobility services. The Central Treasury Operations segment is primarily engaged in decision making for investments, risk management activities, and providing financing for the Automotive segment. F’s current market cap is $45.3 billion.
Earnings and Sales Growth: Over the last twelve months, earnings decreased by -41.2% while sales grew 10.34%. In the last quarter, earnings were about -56% lower while sales decreased by -2%. The earnings trend reflects a multiyear pattern that has prompted management to transform its entire business to focus its production efforts on SUVs, crossover vehicles and pickup trucks (the one notably exception in sedans is the Mustang), and to move 40% of its business into the emerging EV segment by 2030. The company operates with a historically narrow margin profile that has seen margins deteriorate over the last year; on a trailing twelve-month basis, Net Income was 5.94% of Revenues, and fell to -2.1% in the last quarter. The drop to negative Net Income in the last quarter is a significant red flag.
Free Cash Flow: F’s free cash flow is healthy, at more than $9 billion over the last twelve months. That translates to a Free Cash Flow Yield of 5.94. It should also be noted that Free Cash Flow has declined significantly over the past twelve months, from $10.8 billion a year ago and $23.9 billion in early 2021.
Debt to Equity: F has a debt/equity ratio of 2. High debt/equity ratios aren’t unusual for automotive stocks, however it should be noted that F’s debt/equity is the highest among U.S. automakers. It is also worth pointing out that the lion’s share of their $84.2 billion in long-term debt is attributable to the Ford Credit financing arm of their business; if you subtract this number, their total debt is only about $20.3 billion, while their balance sheet also shows $40 billion in cash and liquid assets.
Dividend: F pays an annual dividend of $.60 per share, which translates to a yield of 5.09% per year at the stock’s current price. Management increased the dividend from $.40 per share after their July earnings announcement. An increasing dividend is a strong sign of management confidence.
Price/Book Ratio: there are a lot of ways to measure how much a stock should be worth; but I like to work with a combination of Price/Book and Price/Cash Flow analysis. Together, these measurements provide a long-term, fair value target around $9.50 per share. That means that F is overvalued by about -15% from its current price, with a useful discount a little under $8 per share. It’s also worth noting that in the first quarter of this year, this same analysis offered a long-term value target at around $15 per share.
Technical Profile
Here’s a look at the stock’s latest technical chart.
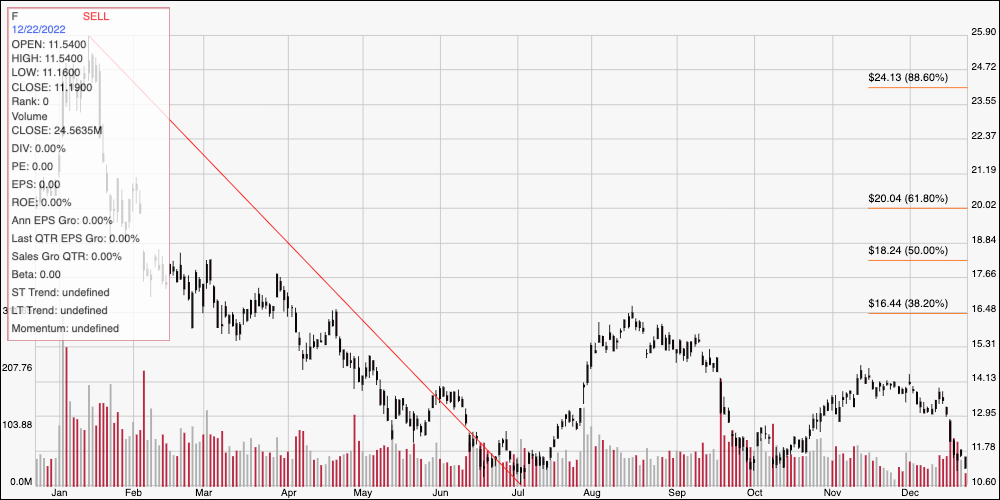
Current Price Action/Trends and Pivots: The red diagonal line measures the length of the stock’s downward trend from its high in mid-January at around $26 per share to its July low at around $10.50; it also informs the Fibonacci trend retracement lines shown on the right side of the chart. Since that low, the stock has staged a couple of temporary, failed rallies, with the latest coming in October, but topping a little above $14 in November. The stock has dropped back again and is nearing its 52-week low, marking current support at $10.50, with immediate resistance at around $11.80. A push above $11.80 will find next resistance at around $13, with additional upside to a little above $14 if buying activity increases. A drop below $10.50 could have downside to about $9.30, using the current distance between support and resistance as a general reference.
Near-term Keys: The strength of the stock’s current, long-term downward trend places any kind of short-term bullish trade on F extremely speculative right now; the only signal that a short-term trader should look for to justify any kind of momentum or swing-based trade with call options, or by buying the stock is a rally and push above $14 per share. In that case, there could be upside to about $16.50 where the 38.2% retracement line sits, making a bullish trade useful. A drop below $10.50 could mark a good signal to consider shorting the stock or working with put options, with $9.30 to $9 offering a practical exit target on a bearish trade. Despite its underlying fundamental strengths, however, F doesn’t offer a useful value proposition right now.