Like most investors, I’ve always looked at the market, at least partially, through the lens of my own personal and professional experience. As a self-described nerd with a lot of experience and education in software and technology, it’s pretty natural for me to gravitate to stocks in tech-driven industries.
The Technology sector has been a major driver of economic growth since 2020, and in fact is typically at the head of the pack in driving market movements. That’s been true in 2022 as well, but driving at the front of the pack in this case means that the Tech sector has been leading the market down for all of the past year. Many of the most well-known names in the sector, and in industries like Semiconductors have been cut in half or more as supply chain issues and inflation have both created an overriding, negative narrative this year.
The Semiconductor industry, specifically is one that I’ve learned to pay a lot of attention to, simply because the companies in this industry produce the products that drive innovation in practically every other sector of the economy. Want to talk about 5G? Memory chips in smartphones and other mobile devices are a small piece of Semiconductor’s place in future mobile Web connectivity. Self-driving cars, electric vehicles? “Smart” home appliances? Guess what – they all rely on semiconductors to one extent or another. That makes Semi stocks some of the most interesting companies in the market, from my view.
Micron Technology, Inc. (MU) is a leading company in the Semiconductor industry, and are most known for their memory products, such as DRAM, NAND, and Flash solutions for solid-state hard drives and memory modules. The stock has followed the rest of the Tech sector lower over the past year, dropping from a December 2021 high at around $98.50 to its latest low at around $48.50 in late September, and revisited again as we move into the last week of 2022. The stock has been trying to build bullish momentum from that point. The company itself has an interesting mix of positive fundamental elements in place; are they good enough to make the stock’s long-term downward look like an opportunity for bargain hunters? Let’s find out.
Fundamental and Value Profile
Micron Technology, Inc. (MU) is engaged in semiconductor systems. The Company’s portfolio of memory technologies, including dynamic random-access memory (DRAM), negative-AND (NAND) Flash and NOR Flash are the basis for solid-state drives, modules, multi-chip packages and other system solutions. Its business segments include Compute and Networking Business Unit (CNBU), which includes memory products sold into compute, networking, graphics and cloud server markets; Mobile Business Unit (MBU), which includes memory products sold into smartphone, tablet and other mobile-device markets; Storage Business Unit (SBU), which includes memory products sold into enterprise, client, cloud and removable storage markets, and SBU also includes products sold to Intel through its Intel/Micron Flash Technology (IMFT) joint venture, and Embedded Business Unit (EBU), which includes memory products sold into automotive, industrial, connected home and consumer electronics markets. MU’s current market cap is $54.3 billion.
Earnings and Sales Growth: Over the last twelve months, earnings declined by -107.25%, while revenues decreased by nearly -47%. In the last quarter, earnings were more than -111% lower, while sales declined a little more than -38.5%. The company’s operating profile has narrowed dramatically throughout the past year; Net Income was about 23% of Revenues a year ago on a trailing twelve-month basis, but deteriorated to -4.77% in the last quarter. The drop to negative Net Income is a big red flag that I believe reflects broad inflationary pressures the entire sector continues to grapple with.
Free Cash Flow: MU’s free cash flow is modest, and lower over the last twelve months, which confirms the negative twelve-month pattern in Net Income I just described. Over the last year, Free Cash Flow was $930 million (versus $4 billion in the quarter prior) and translates to a Free Cash Flow Yield of 1.7%.
Debt to Equity: MU has a debt/equity ratio of .2. This number reflects the company’s manageable debt levels. The company’s balance sheet indicates cash and liquid assets are a little over $10.5 billion (an increase over about $9.3 billion in the last quarter, and $5 billion at the end of 2018) versus debt of about $10 billion. It should be noted that in the quarter prior, long-term debt was $6.8 billion.
Dividend: MU’s dividend is $.46 per share, per year, and which translates to a minimal yield of 0.92% at the stock’s current price. While the dividend may not sound impressive, management did increase the dividend payout from $.40 per share prior to the company’s July distribution. An increasing dividend – even on a conservative basis – is a strong sign of management confidence.
Price/Book Ratio: there are a lot of ways to measure how much a stock should be worth; but I like to work with a combination of Price/Book and Price/Cash Flow analysis. Together, these measurements provide a long-term, fair value target around $64 per share. That suggests that at its current price, MU is significantly undervalued with 31.5% upside from its current price.
Technical Profile
Here’s a look at the stock’s latest technical chart.
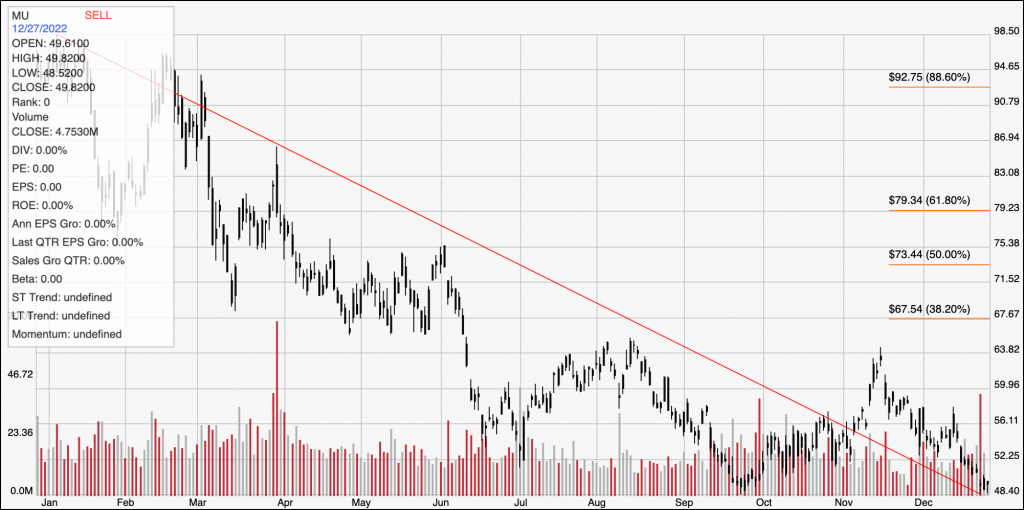
Current Price Action/Trends and Pivots: The red diagonal line measures the length of the stock’s downward trend from January of last year to its low reached first in September, and again just this week at around $48.50 per share. It also informs the Fibonacci trend retracement lines shown on the right side of the chart. Current support is right around the stock’s current price at $48.50, with immediate resistance at about $52 per share. A push above $52 will find next resistance at around $56. A drop below $48.50 should find next support at about $44.50.
Near-term Keys: Despite excellent liquidity and manageable debt, MU’s pattern of declining Free Cash Flow and negative Net Income are significant red flags that I think confirm some of the risks associated with the Semiconductor industry right now. Those risks are significant enough that I’m willing to call MU’s big discount a value trap. That means that the best opportunities to work with MU lie in short-term trading strategies. A push above $52 could be a good signal to consider buying the stock or working with call options, using $56 as a practical bullish target. A drop below $48.50 could be a signal to consider shorting the stock or buying put options, with $44.50 acting as a practical profit target on a bearish trade.