Heading into the end of 2022, the broad market staged a significant rally off of its bear market bottom, raising questions to start the new year of whether that momentum can be sustained.
Since 2020, one of the surprising stories has been the way that a lot of traditional, brick-and-mortar retail companies found creative ways to shift their operations to work in a COVID-restricted world, and how many of those emergency measures still shape the way they do business today. That includes leveraging technology to expand omnichannel sales and delivery methods that to meet continued demand for their goods. While I hesitate to use the term “post-COVID” to describe current conditions, it is still a fact that these elements have continued to play a big role in helping these businesses manage sales and profitability to demonstrate healthy balance sheets, robust cash flows, and improving operating margins even after the worst effects of the pandemic have faded.
The last year or so has shifted the narrative a bit away from COVID and onto the reality that the stimulus programs used by the federal government during 2020 and 2021 also pushed inflation to levels not seen in the last four decades. Issues that existed prior to the pandemic, like limited chip supply in the Semiconductor industry, along with concerns that began with the health crisis, like labor shortages have all compounded to create extended supply chain issues that have helped to push inflation indicators even higher and prompted the Fed to maintain a hawkish approach to monetary policy that is expected to persist through most of 2023.
The economic questions I’ve just described could put Specialty Retail industry in a dangerous spot, which is why it isn’t too surprising that a lot of well-known names in the industry are still significantly below their 2021 highs. That includes Best Buy Co (BBY). BBY resides in an intensely competitive landscape that was already fierce, but that has been under more and more pressure for a number of years from inroads made by Amazon (AMZN) in its digital and technology-centric offerings while still facing intense competition from big-box retailers like Walmart (WMT) and Target (TGT). That is a symptom of what has become a clear, long-term, “sea change” kind of shift by consumers away from traditional brick and mortar stores to online shopping alternatives.
BBY has been working hard to stay relevant amidst that change, and many of those changes are what enabled the company to succeed during the last two years. This is a company with some interesting fundamental strengths including a very solid balance sheet and free cash flow, manageable debt and an attractive dividend. The stock dropped more than -50% from its November 2021 peak to an October 2022 low, but rallied into the Christmas holiday. Since then, it’s been consolidating in a narrow trading range. Does that consolidation represent an opportunity to get in at a good value price for long-term investors, or would it smarter to wait? Let’s find out.
Fundamental and Value Profile
Best Buy Co., Inc. is a provider of technology products, services and solutions. The Company offers products and services to the customers visiting its stores, engaging with Geek Squad agents, or using its Websites or mobile applications. It has operations in the United States, Canada and Mexico. The Company operates through two segments: Domestic and International. The Domestic segment consists of the operations in all states, districts and territories of the United States, under various brand names, including Best Buy, bestbuy.com, Best Buy Mobile, Best Buy Direct, Best Buy Express, Geek Squad, Magnolia Home Theater, and Pacific Kitchen and Home. The International segment consists of all operations in Canada and Mexico under the brand names, Best Buy, bestbuy.com.ca, bestbuy.com.mx, Best Buy Express, Best Buy Mobile and Geek Squad. As of December 31, 2016, the Company operated 1,200 large-format and 400 small-format stores throughout its Domestic and International segments. BBY’s market cap is $18.1 billion.
Earnings and Sales Growth: Over the last twelve months, earnings declined by -33.65%, while also dropped by -11.11%. In the last quarter, earnings were -10.39% lower while sales increased by 2.5%. BBY operates with a very narrow margin profile that has weakened somewhat. Over the last twelve months, Net Income was about 3.23% of Revenues, and slid back in the last quarter the number to 2.62%.
Free Cash Flow: BBY’s Free Cash Flow over the last twelve months was about $1.2 billion. That translates to a Free Cash Flow Yield of 6.53%. The current number marks an improvement from $824 million in the last quarter, but a drop from $2.5 billion a year ago.
Debt to Equity: the company’s debt to equity ratio is .38, a very low number that reflects the company’s biggest strength, which can be seen in its balance sheet, which shows $932 million in cash and liquid assets against about $1.15 billion in long-term debt. Cash has declined over the past year, from $2.9 billion a year ago, however their debt is manageable.
Dividend: BBY pays an annual dividend of $3.52 per share, which translates to an annual yield of about 4.32% at the stock’s current price. It’s worth noting that BBY has increased their dividend from $2.00 at the end of 2019, $2.10 in 2020, and $2.80 in 2022. The ability to raise its dividend is a notable sign of strength.
Price/Book Ratio: there are a lot of ways to measure how much a stock should be worth; but I like to work with a combination of Price/Book and Price/Cash Flow analysis. Together, these measurements provide a long-term, fair value target around $66.21 per share. That suggests that BBY is overvalued, with -19% downside from their current price and a useful discount price at around $53.
Technical Profile
Here’s a look at the stock’s latest technical chart.
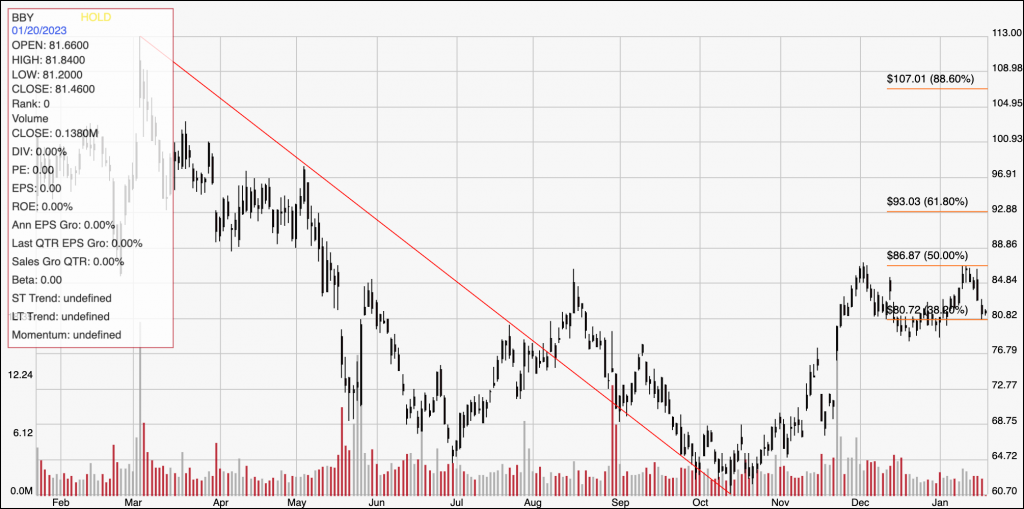
Current Price Action: This chart represents BBY’s price activity over the past year. The red diagonal line traces the stock’s fall from its $113 high in February of last year to its October low at around $61. It also provides the baseline for the Fibonacci retracement lines shown on the right side of the chart. The stock rallied from that low to its latest peak at around $88, reached in December and again early this month to mark immediate resistance at that level. Current support is around $80, which is roughly inline with the 38.2% retracement. The distance between those current support and resistance levels also defines the consolidation range the stock has held since the beginning of December. A push above $88 should have upside to about $93, where the 61.8% retracement line waits to provide secondary resistance. A drop below $80 should find next support at around $76 per share.
Near-term Keys: If you’re looking for a value-based, long-term investment, BBY has some useful fundamental strengths, but lacks the value proposition to make me want to take it seriously right now. The stock would need to drop to around $53 before a stronger value-based argument can be made. If you’re looking for a short-term opportunity, however, there are a couple of signal points that could be useful. A push above resistance at $88 could act as a good signal to consider buying the stock or working with call options, with a short-term, momentum-based target price at around $93 per share. If the stock drops below current support at $80, you could also think about shorting the stock or buying put options, with an eye on $76 as a useful profit target on a bearish trade.