In 2023, one of the biggest questions that seems to overshadow the market is if interest rates will begin to decline this year.
Employment has been of the biggest benchmarks the Fed has used to evaluate the need to raise, lower or maintain their interest rate policy over the last several years. Every month, the market seems to hold its breath as a new set of unemployment and salary data is made available and everybody gets to wonder what the information means for the current economic climate and, therefore, for interest rates. With the Fed expected to stay hawkish through most of this year in an effort to contain inflation, many of the more pessimistic economists and analysts are suggesting that the Fed won’t accomplish the “soft landing” that many hope for, but instead push the U.S. economy straight into its next recession. That also begs the question of whether employment numbers will remain generally healthy as certain sectors of the market – the Tech sector in particular right now – are starting to reduce their workforce.
ManpowerGroup Inc. (MAN) is one of the largest providers of workforce solutions and services, with operations that span the globe. From 2020 to 2022, the most dramatically affected industries were those that rely the most on face-to-face interactions, such as restaurants, theaters, and so on. The pandemic has also forced much of corporate America to shift to work-at-home operations that are still in place, even as companies have resumed largely normal activities. Healthy employment is a good sign for MAN, but rising interest rates, over a prolonged period of time eventually blunt demand for new workers, which is why the current environment presents the spectre of increasing risk for their stock.
After following a downward trend for most of 2022 (in response to the rising interest rate environment, and in lockstep with the rest of the broad market), MAN has staged an impressive rally that started in October of last year from a low point at around $64 per share. Since December, the stock has settled into a new, higher consolidation range in the mid-to-high $80 range. Aside from interest rate questions that are beyond the company’s control, MAN also has an interesting set of fundamental strengths working in its favor, including healthy free cash flow, a solid balance sheet, and improving profitability. Where is its value price in relation to the stock’s latest big rally? Let’s find out.
Fundamental and Value Profile
ManpowerGroup Inc. is a provider of workforce solutions and services. The Company’s segments include Americas, which includes the United States and Other Americas; Southern Europe, which includes France, Italy and Other Southern Europe; Northern Europe, and Asia Pacific Middle East (APME). It offers a range of workforce solutions and services, which includes recruitment and assessment, training and development, career management, outsourcing, and workforce consulting. Its family of brands and offerings includes Manpower, Experis, and Talent Solutions. The Manpower brand offers contingent staffing and permanent recruitment. The Experis brand offers professional resourcing and project-based solutions. Talent Solutions brand is designed to address client needs for its capability offerings, integrated and data-driven workforce solutions, as well as delivery across multiple countries. Its subsidiaries include Greythorn Pty Ltd., Manpower Services (Australia) Pty. Ltd. and Salespower S.A. MAN’s current market cap is $4.5 billion.
Earnings and Sales Growth: Over the last twelve months, earnings increased by about 14.5%, while revenues declined by about -6.6%. In the last quarter, earnings decreased by -5.15%, while sales also slipped -5.38%. MAN operates with a very narrow margin profile that is showing signs of improvement; over the last twelve months, Net Income was 2.14% of Revenues, and improved to 2.32% in the last quarter. This is an encouraging trend under current economic conditions.
Free Cash Flow: MAN’s free cash flow is healthy, at about $477 million. This is a number that is a bit lower from a year ago, when Free Cash Flow was $580.6 million, but improved from $389.5 million in the quarter prior. The current number translates to a healthy Free Cash Flow yield of 10.68%.
Debt to Equity: MAN has a debt/equity ratio of .37. This is a conservative number that implies management takes a conservative approach to leverage. The company’s balance sheet indicates that operating margins are sufficient to service its conservative level of debt, with good liquidity from about $527.5 million in cash and liquid assets against $883 million in long-term debt.
Dividend: MAN pays an annual dividend of $2.72 per share, which translates to a yield of about 3.08% at the stock’s current price. MAN’s dividend has also grown consistently, from $2.02 per share it paid in mid-2019 to $2.18 in 2020, $2.52 in 2021, and raised to its current level in mid-2022. It also provides additional evidence of healthy underlying fundamental strength.
Price/Book Ratio: there are a lot of ways to measure how much a stock should be worth; but I like to work with a combination of Price/Book and Price/Cash Flow analysis. Together, these measurements provide a long-term, fair value target at about $95.50 per share. That suggests that the stock modestly undervalued right now, with about 8% upside from the stock’s current price, and a practical discount price at around $76.50 per share.
Technical Profile
Here’s a look at the stock’s latest technical chart.
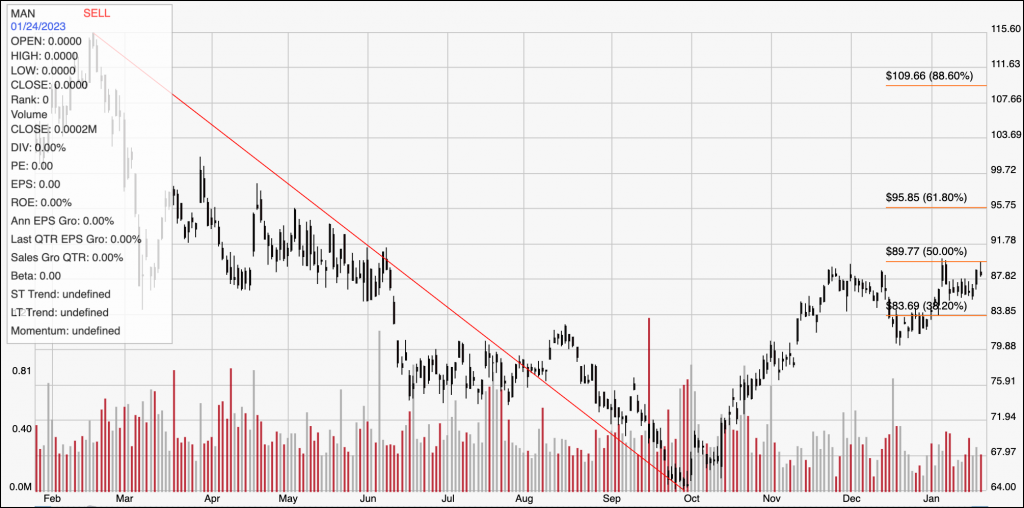
Current Price Action/Trends and Pivots: The red diagonal line measures the length of the stock’s downward trend from its February 2022 high at around $115.50 to its low in October of last year at around $64; it also informs the Fibonacci trend retracement lines shown on the right side of the chart. From that low, the stock has moved into a new upward trend that has been consolidating since December between immediate resistance at around $90 and current support at around $80 per share. A push above $90 should have short-term upside to about $96 before finding next resistance, while a drop below $80 could see the stock fall to about $75 before finding next support.
Near-term Keys: If you’re looking for a short-term bullish trade, MAN offer an interesting signal to think about buying the stock or working with call options with a push above $90 per share. If that happens, use $96 as a practical exit target on a bullish trade. If momentum reverses and pushes the stock below $80, you could also consider shorting the stock or buying put options, with $75 providing a practical profit target on a bearish trade. The value proposition is modest, but not high enough to be interesting at the stock’s current price.